mempool and cacheline ping pong
Hi Mark, While trying to figure out a random failure in the mempool tests[0] introduced when fixing a bug in how mempool selects shards holding the byte count of a given pool[1] earlier this year, I was intrigued by this "cache line ping pong" problem[2]. And I wonder if you have some kind of benchmark, somewhere in your toolbox, that someone could use to demonstrate the problem. Maybe such a code could be adapted to show the benefit of the optimization implemented in mempool? Cheers [0] https://tracker.ceph.com/issues/49781#note-9 [1] https://github.com/ceph/ceph/pull/39057/files [2] https://www.drdobbs.com/parallel/understanding-and-avoiding-memory-issues/21... -- Loïc Dachary, Artisan Logiciel Libre
Hi Loïc, I don't have any tests specifically for this, but looking at #39057, I wonder if something could be crafted using the check_shard_select test that Adam wrote as a template. What do you think? Mark On 3/16/21 3:52 PM, Loïc Dachary wrote:
Hi Mark,
While trying to figure out a random failure in the mempool tests[0] introduced when fixing a bug in how mempool selects shards holding the byte count of a given pool[1] earlier this year, I was intrigued by this "cache line ping pong" problem[2]. And I wonder if you have some kind of benchmark, somewhere in your toolbox, that someone could use to demonstrate the problem. Maybe such a code could be adapted to show the benefit of the optimization implemented in mempool?
Cheers
[0] https://tracker.ceph.com/issues/49781#note-9 [1] https://github.com/ceph/ceph/pull/39057/files [2] https://www.drdobbs.com/parallel/understanding-and-avoiding-memory-issues/21...
_______________________________________________ Dev mailing list -- dev@ceph.io To unsubscribe send an email to dev-leave@ceph.io
On 16/03/2021 22:01, Mark Nelson wrote:
Hi Loïc,
I don't have any tests specifically for this, but looking at #39057, I wonder if something could be crafted using the check_shard_select test that Adam wrote as a template. What do you think? That sounds like a good idea. And maybe using cachegrind[0] also?
[0] https://www.valgrind.org/docs/manual/cg-manual.html
Mark
On 3/16/21 3:52 PM, Loïc Dachary wrote:
Hi Mark,
While trying to figure out a random failure in the mempool tests[0] introduced when fixing a bug in how mempool selects shards holding the byte count of a given pool[1] earlier this year, I was intrigued by this "cache line ping pong" problem[2]. And I wonder if you have some kind of benchmark, somewhere in your toolbox, that someone could use to demonstrate the problem. Maybe such a code could be adapted to show the benefit of the optimization implemented in mempool?
Cheers
[0] https://tracker.ceph.com/issues/49781#note-9 [1] https://github.com/ceph/ceph/pull/39057/files [2] https://www.drdobbs.com/parallel/understanding-and-avoiding-memory-issues/21...
_______________________________________________ Dev mailing list -- dev@ceph.io To unsubscribe send an email to dev-leave@ceph.io
Dev mailing list -- dev@ceph.io To unsubscribe send an email to dev-leave@ceph.io
-- Loïc Dachary, Artisan Logiciel Libre
Loic, Here is some discussion on cache false sharing that you may find valuable: https://github.com/ceph/ceph/pull/9431 . Maybe it is possible to turn perf c2c into some systemic check? Best regards, Adam On Tue, 16 Mar 2021 at 22:59, Loïc Dachary <loic@dachary.org> wrote:
On 16/03/2021 22:01, Mark Nelson wrote:
Hi Loïc,
I don't have any tests specifically for this, but looking at #39057, I wonder if something could be crafted using the check_shard_select test that Adam wrote as a template. What do you think? That sounds like a good idea. And maybe using cachegrind[0] also?
[0] https://www.valgrind.org/docs/manual/cg-manual.html
Mark
On 3/16/21 3:52 PM, Loïc Dachary wrote:
Hi Mark,
While trying to figure out a random failure in the mempool tests[0]
introduced when fixing a bug in how mempool selects shards holding the byte count of a given pool[1] earlier this year, I was intrigued by this "cache line ping pong" problem[2]. And I wonder if you have some kind of benchmark, somewhere in your toolbox, that someone could use to demonstrate the problem. Maybe such a code could be adapted to show the benefit of the optimization implemented in mempool?
Cheers
[0] https://tracker.ceph.com/issues/49781#note-9 [1] https://github.com/ceph/ceph/pull/39057/files [2]
https://www.drdobbs.com/parallel/understanding-and-avoiding-memory-issues/21...
_______________________________________________ Dev mailing list -- dev@ceph.io To unsubscribe send an email to dev-leave@ceph.io
_______________________________________________ Dev mailing list -- dev@ceph.io To unsubscribe send an email to dev-leave@ceph.io
-- Loïc Dachary, Artisan Logiciel Libre
_______________________________________________ Dev mailing list -- dev@ceph.io To unsubscribe send an email to dev-leave@ceph.io
Hi Adam, Thanks for the pointer: very informative indeed :-) perf c2c seems to be a good tool and works on my laptop. I'll have to dig deeper to figure out what it does exactly. To be continued! Cheers On 17/03/2021 08:48, Adam Kupczyk wrote:
Loic,
Here is some discussion on cache false sharing that you may find valuable: https://github.com/ceph/ceph/pull/9431 <https://github.com/ceph/ceph/pull/9431> . Maybe it is possible to turn perf c2c into some systemic check?
Best regards, Adam
On Tue, 16 Mar 2021 at 22:59, Loïc Dachary <loic@dachary.org <mailto:loic@dachary.org>> wrote:
On 16/03/2021 22:01, Mark Nelson wrote: > Hi Loïc, > > > I don't have any tests specifically for this, but looking at #39057, I wonder if something could be crafted using the check_shard_select test that Adam wrote as a template. What do you think? That sounds like a good idea. And maybe using cachegrind[0] also?
[0] https://www.valgrind.org/docs/manual/cg-manual.html <https://www.valgrind.org/docs/manual/cg-manual.html> > > > Mark > > > On 3/16/21 3:52 PM, Loïc Dachary wrote: >> Hi Mark, >> >> While trying to figure out a random failure in the mempool tests[0] introduced when fixing a bug in how mempool selects shards holding the byte count of a given pool[1] earlier this year, I was intrigued by this "cache line ping pong" problem[2]. And I wonder if you have some kind of benchmark, somewhere in your toolbox, that someone could use to demonstrate the problem. Maybe such a code could be adapted to show the benefit of the optimization implemented in mempool? >> >> Cheers >> >> [0] https://tracker.ceph.com/issues/49781#note-9 <https://tracker.ceph.com/issues/49781#note-9> >> [1] https://github.com/ceph/ceph/pull/39057/files <https://github.com/ceph/ceph/pull/39057/files> >> [2] https://www.drdobbs.com/parallel/understanding-and-avoiding-memory-issues/21... <https://www.drdobbs.com/parallel/understanding-and-avoiding-memory-issues/212400410> >> >> >> _______________________________________________ >> Dev mailing list -- dev@ceph.io <mailto:dev@ceph.io> >> To unsubscribe send an email to dev-leave@ceph.io <mailto:dev-leave@ceph.io> > _______________________________________________ > Dev mailing list -- dev@ceph.io <mailto:dev@ceph.io> > To unsubscribe send an email to dev-leave@ceph.io <mailto:dev-leave@ceph.io>
-- Loïc Dachary, Artisan Logiciel Libre
_______________________________________________ Dev mailing list -- dev@ceph.io <mailto:dev@ceph.io> To unsubscribe send an email to dev-leave@ceph.io <mailto:dev-leave@ceph.io>
_______________________________________________ Dev mailing list -- dev@ceph.io To unsubscribe send an email to dev-leave@ceph.io
-- Loïc Dachary, Artisan Logiciel Libre
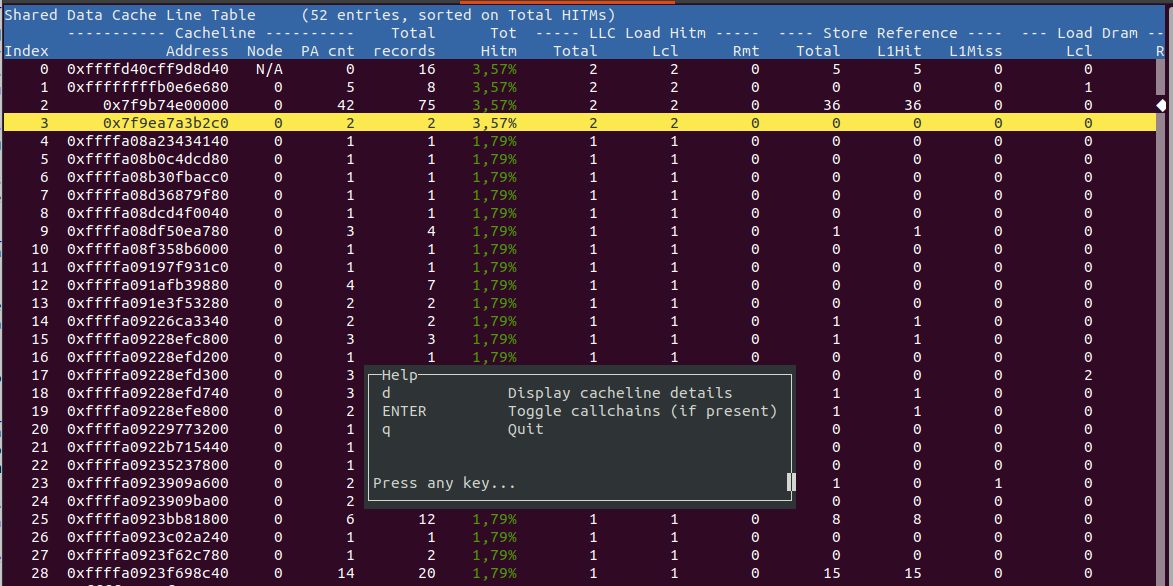
After reading Joe Mario's comments[0] and blog post[1] (which conveniently includes a source file to demonstrate the cacheline problems[2]), it looks like it would be useful to create a teuthology test that does something similar to the current mempool test[3] while c2c collects information. There could be two runs: * N threads looping on shard[0].bytes += value * N threads looping on shard[pick_a_shard()].bytes += value And comparing c2c reports should show the run with sharding is better. Does that sound like a reasonable approach or do you think there is a simpler way to verify the optimization works as expected ? Cheers [0] https://github.com/ceph/ceph/pull/9431 [1] https://joemario.github.io/blog/2016/09/01/c2c-blog/ [2] https://github.com/joemario/perf-c2c-usage-files/blob/master/false_sharing_e... [3] https://github.com/ceph/ceph/blob/3fb62b1a4c5d2a51db3f2b6276c7c48b3d8da201/s... On 17/03/2021 10:16, Loïc Dachary wrote:
Hi Adam,
Thanks for the pointer: very informative indeed :-) perf c2c seems to be a good tool and works on my laptop. I'll have to dig deeper to figure out what it does exactly. To be continued!
Cheers
On 17/03/2021 08:48, Adam Kupczyk wrote:
Loic,
Here is some discussion on cache false sharing that you may find valuable: https://github.com/ceph/ceph/pull/9431 <https://github.com/ceph/ceph/pull/9431> . Maybe it is possible to turn perf c2c into some systemic check?
Best regards, Adam
On Tue, 16 Mar 2021 at 22:59, Loïc Dachary <loic@dachary.org <mailto:loic@dachary.org>> wrote:
On 16/03/2021 22:01, Mark Nelson wrote: > Hi Loïc, > > > I don't have any tests specifically for this, but looking at #39057, I wonder if something could be crafted using the check_shard_select test that Adam wrote as a template. What do you think? That sounds like a good idea. And maybe using cachegrind[0] also?
[0] https://www.valgrind.org/docs/manual/cg-manual.html <https://www.valgrind.org/docs/manual/cg-manual.html> > > > Mark > > > On 3/16/21 3:52 PM, Loïc Dachary wrote: >> Hi Mark, >> >> While trying to figure out a random failure in the mempool tests[0] introduced when fixing a bug in how mempool selects shards holding the byte count of a given pool[1] earlier this year, I was intrigued by this "cache line ping pong" problem[2]. And I wonder if you have some kind of benchmark, somewhere in your toolbox, that someone could use to demonstrate the problem. Maybe such a code could be adapted to show the benefit of the optimization implemented in mempool? >> >> Cheers >> >> [0] https://tracker.ceph.com/issues/49781#note-9 <https://tracker.ceph.com/issues/49781#note-9> >> [1] https://github.com/ceph/ceph/pull/39057/files <https://github.com/ceph/ceph/pull/39057/files> >> [2] https://www.drdobbs.com/parallel/understanding-and-avoiding-memory-issues/21... <https://www.drdobbs.com/parallel/understanding-and-avoiding-memory-issues/212400410> >> >> >> _______________________________________________ >> Dev mailing list -- dev@ceph.io <mailto:dev@ceph.io> >> To unsubscribe send an email to dev-leave@ceph.io <mailto:dev-leave@ceph.io> > _______________________________________________ > Dev mailing list -- dev@ceph.io <mailto:dev@ceph.io> > To unsubscribe send an email to dev-leave@ceph.io <mailto:dev-leave@ceph.io>
-- Loïc Dachary, Artisan Logiciel Libre
_______________________________________________ Dev mailing list -- dev@ceph.io <mailto:dev@ceph.io> To unsubscribe send an email to dev-leave@ceph.io <mailto:dev-leave@ceph.io>
_______________________________________________ Dev mailing list -- dev@ceph.io To unsubscribe send an email to dev-leave@ceph.io
-- Loïc Dachary, Artisan Logiciel Libre
Hi Loïc, Per our email discussion, I'm happy to help. If you or anyone else can run perf c2c, I will analyze the results and reply back with the findings. The perf c2c output is a bit non-intuitive, but it conveys a lot. I'm happy to share the findings. Here's what I recommend: 1) Get on an Intel system where you're pushing Ceph really hard. (AMD uses different low level perf events that haven't been ported over yet.) 2) Make sure the Ceph code you're running has debug info in it and isn't stripped. 3) This needs to be run on bare-metal. The PEBS perf events used by c2c are not supported in a virtualized guest (Intel says support is coming in newer cpus). 3) As any fyi, the less cpu pinning you do, the more cacheline contention c2c will expose. 4) Once you run the commands that I've appended below (as root), then tar up everything, data files and all, and lftp them to the location below: $ lftp dropbox.redhat.com > cd /incoming > put unique-filename Please let me know the name of the files that you uploaded after you put them there. I'll grab them. I just joined this list and I don't know if I'll get notified of the replies, so send me email when the files are there for me to grab. Does that sound OK? Holler if you have any questions. Joe # First get some background system info uname -a > uname.out lscpu > lscpu.out cat /proc/cmdline > cmdline.out timeout -s INT 10 vmstat -w 1 > vmstat.out nodecnt=`lscpu|grep "NUMA node(" |awk '{print $3}'` for ((i=0; i<$nodecnt; i++)) do cat /sys/devices/system/node/node${i}/meminfo > meminfo.$i.out done more `find /proc -name status` > proc_parent_child_status.out more /proc/*/numa_maps > numa_maps.out # # Get separate kernel and user perf-c2c stats # perf c2c record -a --ldlat=70 --all-user -o perf_c2c_a_all_user.data sleep 5 perf c2c report --stdio -i perf_c2c_a_all_user.data > perf_c2c_a_all_user.out 2>&1 perf c2c report --full-symbols --stdio -i perf_c2c_a_all_user.data > perf_c2c_full-sym_a_all_user.out 2>&1 perf c2c record -g -a --ldlat=70 --all-user -o perf_c2c_g_a_all_user.data sleep 5 perf c2c report -g --stdio -i perf_c2c_g_a_all_user.data > perf_c2c_g_a_all_user.out 2>&1 perf c2c record -a --ldlat=70 --all-kernel -o perf_c2c_a_all_kernel.data sleep 4 perf c2c report --stdio -i perf_c2c_a_all_kernel.data > perf_c2c_a_all_kernel.out 2>&1 perf c2c record -g --ldlat=70 -a --all-kernel -o perf_c2c_g_a_all_kernel.data sleep 4 perf c2c report -g --stdio -i perf_c2c_g_a_all_kernel.data > perf_c2c_g_a_all_kernel.out 2>&1 # # Get combined kernel and user perf-c2c stats # perf c2c record -a --ldlat=70 -o perf_c2c_a_both.data sleep 4 perf c2c report --stdio -i perf_c2c_a_both.data > perf_c2c_a_both.out 2>&1 perf c2c record -g --ldlat=70 -a --all-kernel -o perf_c2c_g_a_both.data sleep 4 perf c2c report -g --stdio -i perf_c2c_g_a_both.data > perf_c2c_g_a_both.out 2>&1 # # Get all-user physical addr stats, in case multiple threads or processes are # accessing shared memory with different vaddrs. # perf c2c record --phys-data -a --ldlat=70 --all-user -o perf_c2c_a_all_user_phys_data.data sleep 5 perf c2c report --stdio -i perf_c2c_a_all_user_phys_data.data > perf_c2c_a_all_user_phys_data.out 2>&1
Hi Loïc, It looks like the commands that I posted in my last reply got wrapped and garbled. Try grabbing them from this script instead. http://people.redhat.com/jmario/scratch/run_c2c_ceph.sh Joe
Hi Joe, I can't tell you how happy I am that you're around to help understand this :-) In the spirit of making baby steps to better understand what's going on, I'd like to run a small part of Ceph[0] that is designed to be optimized and avoid cacheline ping pong. The code running this part would be in a test (similar to an existing one[1]). It would be launched on a single Intel machine (as part of a teuthology run, the integration test tool specific to Ceph) and use the commands you suggest. After the first run I'll send the data to you for interpretation (sounds like consulting an oracle :-) ). With your help I'm hoping the integration test will assert that running the mempool with the optimization is at least X% faster than without the optimization and fail otherwise. That would be very helpful to guard against accidental regressions. Once this first goal is achieved, collecting data from a Ceph cluster running under load could follow the same methodology. I'm sure Mark Nelson will be most interested in this more ambitious target. If I'm not mistaken, the commands (let say they are in a ceph-c2c.sh script) should be run like this: * Run the software (be it mempool simulation or Ceph under load), let it warm up * Run ceph-c2c.sh (it won't take more than a minute or so to complete) * Collect the data and save them * Kill the software Is that correct? Cheers [0] https://github.com/ceph/ceph/blob/2b21735498c98299d5ce383011c3dbe25aaee70f/s... [1] https://github.com/ceph/ceph/blob/2b21735498c98299d5ce383011c3dbe25aaee70f/s... On 18/03/2021 16:40, jmario@redhat.com wrote:
Hi Loïc, Per our email discussion, I'm happy to help. If you or anyone else can run perf c2c, I will analyze the results and reply back with the findings.
The perf c2c output is a bit non-intuitive, but it conveys a lot. I'm happy to share the findings.
Here's what I recommend: 1) Get on an Intel system where you're pushing Ceph really hard. (AMD uses different low level perf events that haven't been ported over yet.) 2) Make sure the Ceph code you're running has debug info in it and isn't stripped. 3) This needs to be run on bare-metal. The PEBS perf events used by c2c are not supported in a virtualized guest (Intel says support is coming in newer cpus). 3) As any fyi, the less cpu pinning you do, the more cacheline contention c2c will expose. 4) Once you run the commands that I've appended below (as root), then tar up everything, data files and all, and lftp them to the location below:
$ lftp dropbox.redhat.com > cd /incoming > put unique-filename
Please let me know the name of the files that you uploaded after you put them there. I'll grab them. I just joined this list and I don't know if I'll get notified of the replies, so send me email when the files are there for me to grab.
Does that sound OK? Holler if you have any questions. Joe
# First get some background system info uname -a > uname.out lscpu > lscpu.out cat /proc/cmdline > cmdline.out timeout -s INT 10 vmstat -w 1 > vmstat.out
nodecnt=`lscpu|grep "NUMA node(" |awk '{print $3}'` for ((i=0; i<$nodecnt; i++)) do cat /sys/devices/system/node/node${i}/meminfo > meminfo.$i.out done more `find /proc -name status` > proc_parent_child_status.out more /proc/*/numa_maps > numa_maps.out
# # Get separate kernel and user perf-c2c stats # perf c2c record -a --ldlat=70 --all-user -o perf_c2c_a_all_user.data sleep 5 perf c2c report --stdio -i perf_c2c_a_all_user.data > perf_c2c_a_all_user.out 2>&1 perf c2c report --full-symbols --stdio -i perf_c2c_a_all_user.data > perf_c2c_full-sym_a_all_user.out 2>&1
perf c2c record -g -a --ldlat=70 --all-user -o perf_c2c_g_a_all_user.data sleep 5 perf c2c report -g --stdio -i perf_c2c_g_a_all_user.data > perf_c2c_g_a_all_user.out 2>&1
perf c2c record -a --ldlat=70 --all-kernel -o perf_c2c_a_all_kernel.data sleep 4 perf c2c report --stdio -i perf_c2c_a_all_kernel.data > perf_c2c_a_all_kernel.out 2>&1
perf c2c record -g --ldlat=70 -a --all-kernel -o perf_c2c_g_a_all_kernel.data sleep 4 perf c2c report -g --stdio -i perf_c2c_g_a_all_kernel.data > perf_c2c_g_a_all_kernel.out 2>&1
# # Get combined kernel and user perf-c2c stats # perf c2c record -a --ldlat=70 -o perf_c2c_a_both.data sleep 4 perf c2c report --stdio -i perf_c2c_a_both.data > perf_c2c_a_both.out 2>&1
perf c2c record -g --ldlat=70 -a --all-kernel -o perf_c2c_g_a_both.data sleep 4 perf c2c report -g --stdio -i perf_c2c_g_a_both.data > perf_c2c_g_a_both.out 2>&1
# # Get all-user physical addr stats, in case multiple threads or processes are # accessing shared memory with different vaddrs. # perf c2c record --phys-data -a --ldlat=70 --all-user -o perf_c2c_a_all_user_phys_data.data sleep 5 perf c2c report --stdio -i perf_c2c_a_all_user_phys_data.data > perf_c2c_a_all_user_phys_data.out 2>&1 _______________________________________________ Dev mailing list -- dev@ceph.io To unsubscribe send an email to dev-leave@ceph.io
-- Loïc Dachary, Artisan Logiciel Libre
Hi Loïc,
If I'm not mistaken, the commands (let say they are in a ceph-c2c.sh script) should be run like this:
* Run the software (be it mempool simulation or Ceph under load), let it warm up * Run ceph-c2c.sh (it won't take more than a minute or so to complete) * Collect the data and save them * Kill the software
Is that correct?
That sounds great. Thank you. Joe
Ok then: I'll start working on it tomorrow and ping you when the data is ready. It may take a few weeks because of other obligations but it will happen :-) On 18/03/2021 18:42, jmario@redhat.com wrote:
Hi Loïc,
If I'm not mistaken, the commands (let say they are in a ceph-c2c.sh script) should be run like this:
* Run the software (be it mempool simulation or Ceph under load), let it warm up * Run ceph-c2c.sh (it won't take more than a minute or so to complete) * Collect the data and save them * Kill the software
Is that correct? That sounds great. Thank you. Joe
Dev mailing list -- dev@ceph.io To unsubscribe send an email to dev-leave@ceph.io
-- Loïc Dachary, Artisan Logiciel Libre
I could not wait and started working on it right away. An issue was opened to track progress[0] and not spam the mailing list. To be continued. [0] https://tracker.ceph.com/issues/49896 On 18/03/2021 19:00, Loïc Dachary wrote:
Ok then: I'll start working on it tomorrow and ping you when the data is ready. It may take a few weeks because of other obligations but it will happen :-)
On 18/03/2021 18:42, jmario@redhat.com wrote:
Hi Loïc,
If I'm not mistaken, the commands (let say they are in a ceph-c2c.sh script) should be run like this:
* Run the software (be it mempool simulation or Ceph under load), let it warm up * Run ceph-c2c.sh (it won't take more than a minute or so to complete) * Collect the data and save them * Kill the software
Is that correct? That sounds great. Thank you. Joe
Dev mailing list -- dev@ceph.io To unsubscribe send an email to dev-leave@ceph.io
-- Loïc Dachary, Artisan Logiciel Libre
Hi Loïc: One quick comment. Normally a script with many commands isn't needed to detect cacheline contention. The reason I gave you one is because I know nothing about your environment, the topology, the system, or the load you're running. The many commands in that script should give me enough information such that I don't come back a 2nd time asking you to rerun something because I needed more information. All it takes is one simple "perf c2c record ..." command to examine cacheline contention. And my goal is to help you see it yourself. Let me know when you have something. Thank you. Joe
Hi Joe, Thanks for the comment, it makes perfect sense. I'm eager to work on it but I'll have be patient and wait until next week. To be continued! On 25/03/2021 13:40, jmario@redhat.com wrote:
Hi Loïc: One quick comment.
Normally a script with many commands isn't needed to detect cacheline contention. The reason I gave you one is because I know nothing about your environment, the topology, the system, or the load you're running. The many commands in that script should give me enough information such that I don't come back a 2nd time asking you to rerun something because I needed more information.
All it takes is one simple "perf c2c record ..." command to examine cacheline contention. And my goal is to help you see it yourself.
Let me know when you have something. Thank you. Joe _______________________________________________ Dev mailing list -- dev@ceph.io To unsubscribe send an email to dev-leave@ceph.io
-- Loïc Dachary, Artisan Logiciel Libre
Hi Nathan, I drafted a c2c standalone teuthology test[0]. Would you be so kind as to push it to GitHub on my behalf so that it builds the corresponding packages? I'm sorry to bother you with this but I don't know if there is another way to build the packages and tell teuthology to get them. Cheers [0] https://lab.fedeproxy.eu/ceph/ceph/-/tree/wip-mempool-cacheline-49781 On 25/03/2021 14:04, Loïc Dachary wrote:
Hi Joe,
Thanks for the comment, it makes perfect sense. I'm eager to work on it but I'll have be patient and wait until next week.
To be continued!
On 25/03/2021 13:40, jmario@redhat.com wrote:
Hi Loïc: One quick comment.
Normally a script with many commands isn't needed to detect cacheline contention. The reason I gave you one is because I know nothing about your environment, the topology, the system, or the load you're running. The many commands in that script should give me enough information such that I don't come back a 2nd time asking you to rerun something because I needed more information.
All it takes is one simple "perf c2c record ..." command to examine cacheline contention. And my goal is to help you see it yourself.
Let me know when you have something. Thank you. Joe _______________________________________________ Dev mailing list -- dev@ceph.io To unsubscribe send an email to dev-leave@ceph.io
-- Loïc Dachary, Artisan Logiciel Libre
Thanks for pushing the branch on my behalf, it built OK[0] and I made some changes. Would you be so kind as to force-push the newer version[1]? [0] https://shaman.ceph.com/builds/ceph/wip-mempool-cacheline-49781/d9cb0ceae50d... [1] https://lab.fedeproxy.eu/ceph/ceph/-/blob/wip-mempool-cacheline-49781/ On 02/04/2021 18:43, Loïc Dachary wrote:
Hi Nathan,
I drafted a c2c standalone teuthology test[0]. Would you be so kind as to push it to GitHub on my behalf so that it builds the corresponding packages? I'm sorry to bother you with this but I don't know if there is another way to build the packages and tell teuthology to get them.
Cheers
[0] https://lab.fedeproxy.eu/ceph/ceph/-/tree/wip-mempool-cacheline-49781
On 25/03/2021 14:04, Loïc Dachary wrote:
Hi Joe,
Thanks for the comment, it makes perfect sense. I'm eager to work on it but I'll have be patient and wait until next week.
To be continued!
On 25/03/2021 13:40, jmario@redhat.com wrote:
Hi Loïc: One quick comment.
Normally a script with many commands isn't needed to detect cacheline contention. The reason I gave you one is because I know nothing about your environment, the topology, the system, or the load you're running. The many commands in that script should give me enough information such that I don't come back a 2nd time asking you to rerun something because I needed more information.
All it takes is one simple "perf c2c record ..." command to examine cacheline contention. And my goal is to help you see it yourself.
Let me know when you have something. Thank you. Joe _______________________________________________ Dev mailing list -- dev@ceph.io To unsubscribe send an email to dev-leave@ceph.io
-- Loïc Dachary, Artisan Logiciel Libre
Hi Nathan, The repos built for https://shaman.ceph.com/builds/ceph/wip-mempool-cacheline-49781/ a few weeks ago expired, would you be so kind as to push the latest from my repo to the ceph-ci repository[1]? Thanks again for your help! [0] https://lab.fedeproxy.eu/ceph/ceph/-/blob/wip-mempool-cacheline-49781/ [1] https://github.com/ceph/ceph-ci/tree/wip-mempool-cacheline-49781 On 04/04/2021 16:49, Loïc Dachary wrote:
Thanks for pushing the branch on my behalf, it built OK[0] and I made some changes. Would you be so kind as to force-push the newer version[1]?
[0] https://shaman.ceph.com/builds/ceph/wip-mempool-cacheline-49781/d9cb0ceae50d... [1] https://lab.fedeproxy.eu/ceph/ceph/-/blob/wip-mempool-cacheline-49781/
On 02/04/2021 18:43, Loïc Dachary wrote:
Hi Nathan,
I drafted a c2c standalone teuthology test[0]. Would you be so kind as to push it to GitHub on my behalf so that it builds the corresponding packages? I'm sorry to bother you with this but I don't know if there is another way to build the packages and tell teuthology to get them.
Cheers
[0] https://lab.fedeproxy.eu/ceph/ceph/-/tree/wip-mempool-cacheline-49781
On 25/03/2021 14:04, Loïc Dachary wrote:
Hi Joe,
Thanks for the comment, it makes perfect sense. I'm eager to work on it but I'll have be patient and wait until next week.
To be continued!
On 25/03/2021 13:40, jmario@redhat.com wrote:
Hi Loïc: One quick comment.
Normally a script with many commands isn't needed to detect cacheline contention. The reason I gave you one is because I know nothing about your environment, the topology, the system, or the load you're running. The many commands in that script should give me enough information such that I don't come back a 2nd time asking you to rerun something because I needed more information.
All it takes is one simple "perf c2c record ..." command to examine cacheline contention. And my goal is to help you see it yourself.
Let me know when you have something. Thank you. Joe _______________________________________________ Dev mailing list -- dev@ceph.io To unsubscribe send an email to dev-leave@ceph.io
-- Loïc Dachary, Artisan Logiciel Libre
Thanks for pushing the branch. I amended it a little and the teuthology run now passes[0]. There are still issues, I'm sure, but it's probably good enough for a pull request. Would you be so kind as to create one based on my branch[1] with the following cover? Thanks a again for your help :-) ---- Title: qa: verify the benefits of mempool cacheline optimization There already is a test to verify the mempool sharding works, in the sense that it uses at least half of the variables available to count the number of allocated objects and their total size. This new test verifies that, with sharding, object counting is at least twice faster than without sharding. It also collects cacheline contention data with the perf c2c tool. The manual analysis of this data shows the optimization gain is indeed related to cacheline contention. Teuthology run: http://pulpito.front.sepia.ceph.com/dachary-2021-04-24_20:04:29-rados:standa... Mailing list discussion: https://lists.ceph.io/hyperkitty/list/dev@ceph.io/thread/XQDJV4NKEY2LOSFVOYD... Refs: https://tracker.ceph.com/issues/49781 ----- [0] http://pulpito.front.sepia.ceph.com/dachary-2021-04-24_20:04:29-rados:standa... [1] https://lab.fedeproxy.eu/ceph/ceph/-/commits/wip-mempool-cacheline-49781 On 24/04/2021 18:08, Loïc Dachary wrote:
Hi Nathan,
The repos built for https://shaman.ceph.com/builds/ceph/wip-mempool-cacheline-49781/ a few weeks ago expired, would you be so kind as to push the latest from my repo to the ceph-ci repository[1]?
Thanks again for your help!
[0] https://lab.fedeproxy.eu/ceph/ceph/-/blob/wip-mempool-cacheline-49781/ [1] https://github.com/ceph/ceph-ci/tree/wip-mempool-cacheline-49781
On 04/04/2021 16:49, Loïc Dachary wrote:
Thanks for pushing the branch on my behalf, it built OK[0] and I made some changes. Would you be so kind as to force-push the newer version[1]?
[0] https://shaman.ceph.com/builds/ceph/wip-mempool-cacheline-49781/d9cb0ceae50d... [1] https://lab.fedeproxy.eu/ceph/ceph/-/blob/wip-mempool-cacheline-49781/
On 02/04/2021 18:43, Loïc Dachary wrote:
Hi Nathan,
I drafted a c2c standalone teuthology test[0]. Would you be so kind as to push it to GitHub on my behalf so that it builds the corresponding packages? I'm sorry to bother you with this but I don't know if there is another way to build the packages and tell teuthology to get them.
Cheers
[0] https://lab.fedeproxy.eu/ceph/ceph/-/tree/wip-mempool-cacheline-49781
On 25/03/2021 14:04, Loïc Dachary wrote:
Hi Joe,
Thanks for the comment, it makes perfect sense. I'm eager to work on it but I'll have be patient and wait until next week.
To be continued!
On 25/03/2021 13:40, jmario@redhat.com wrote:
Hi Loïc: One quick comment.
Normally a script with many commands isn't needed to detect cacheline contention. The reason I gave you one is because I know nothing about your environment, the topology, the system, or the load you're running. The many commands in that script should give me enough information such that I don't come back a 2nd time asking you to rerun something because I needed more information.
All it takes is one simple "perf c2c record ..." command to examine cacheline contention. And my goal is to help you see it yourself.
Let me know when you have something. Thank you. Joe _______________________________________________ Dev mailing list -- dev@ceph.io To unsubscribe send an email to dev-leave@ceph.io
-- Loïc Dachary, Artisan Logiciel Libre
On Sat, Apr 24, 2021 at 11:13:39PM +0200, Loïc Dachary wrote:
Thanks for pushing the branch. I amended it a little and the teuthology run now passes[0]. There are still issues, I'm sure, but it's probably good enough for a pull request. Would you be so kind as to create one based on my branch[1] with the following cover? Thanks a again for your help :-)
Sure, here you go: https://github.com/ceph/ceph/pull/41014
Great! Thank you :-) On 25/04/2021 10:39, Nathan Cutler wrote:
On Sat, Apr 24, 2021 at 11:13:39PM +0200, Loïc Dachary wrote:
Thanks for pushing the branch. I amended it a little and the teuthology run now passes[0]. There are still issues, I'm sure, but it's probably good enough for a pull request. Would you be so kind as to create one based on my branch[1] with the following cover? Thanks a again for your help :-)
Sure, here you go:
-- Loïc Dachary, Artisan Logiciel Libre
Hi Nathan, Josh noticed that one line could be removed[0] from the test script. I did it and repushed[1]. Would you be so kind as to push the change to GitHub? Thanks for your help! [0] https://github.com/ceph/ceph/pull/41014#pullrequestreview-645521549 [1] https://lab.fedeproxy.eu/ceph/ceph/-/tree/wip-mempool-cacheline-49781 On 25/04/2021 17:10, Loïc Dachary wrote:
Great! Thank you :-)
On 25/04/2021 10:39, Nathan Cutler wrote:
On Sat, Apr 24, 2021 at 11:13:39PM +0200, Loïc Dachary wrote:
Thanks for pushing the branch. I amended it a little and the teuthology run now passes[0]. There are still issues, I'm sure, but it's probably good enough for a pull request. Would you be so kind as to create one based on my branch[1] with the following cover? Thanks a again for your help :-) Sure, here you go:
_______________________________________________ Dev mailing list -- dev@ceph.io To unsubscribe send an email to dev-leave@ceph.io
-- Loïc Dachary, Artisan Logiciel Libre
Loïc Dachary <loic@dachary.org>于2021年4月28日 周三18:12写道:
Hi Nathan,
Josh noticed that one line could be removed[0] from the test script. I did it and repushed[1]. Would you be so kind as to push the change to GitHub?
Loïc and Nathan, when testing the change, I ran into an error like: Traceback (most recent call last): File "/home/kchai/teuthology/virtualenv/bin/teuthology-suite", line 33, in <module> sys.exit(load_entry_point('teuthology', 'console_scripts', 'teuthology-suite')()) File "/home/kchai/teuthology/scripts/suite.py", line 189, in main return teuthology.suite.main(args) File "/home/kchai/teuthology/teuthology/suite/__init__.py", line 143, in main run.prepare_and_schedule() File "/home/kchai/teuthology/teuthology/suite/run.py", line 397, in prepare_and_schedule num_jobs = self.schedule_suite() File "/home/kchai/teuthology/teuthology/suite/run.py", line 615, in schedule_suite self.args.newest, job_limit) File "/home/kchai/teuthology/teuthology/suite/run.py", line 467, in collect_jobs self.package_versions File "/home/kchai/teuthology/teuthology/suite/util.py", line 394, in get_package_versions distro_version=os_version, File "/home/kchai/teuthology/teuthology/suite/util.py", line 274, in package_version_for_hash sha1=hash, File "/home/kchai/teuthology/teuthology/packaging.py", line 853, in __init__ super(ShamanProject, self).__init__(project, job_config, ctx, remote) File "/home/kchai/teuthology/teuthology/packaging.py", line 462, in __init__ self._init_from_config() File "/home/kchai/teuthology/teuthology/packaging.py", line 497, in _init_from_config OS.version_codename(self.os_type, self.os_version) File "/home/kchai/teuthology/teuthology/orchestra/opsys.py", line 200, in version_codename (version_or_codename, name)) KeyError: '8.3 not a ubuntu version or codename' I think the root cause is that the rados/standalone test suite includes it’s own faces for choosing a random distro, and my test happened to pick rhel 8.3 for testing, but the distro name was overridden by the one specified by c2c.yaml. That’s why I had a combination of Ubuntu 8.3. I just took the liberty to push another commit to the pull request in hope to test sooner. If it looks sane to you, could you include it in your commit? Or I can do this with your permission.
Thanks for your help!
[0] https://github.com/ceph/ceph/pull/41014#pullrequestreview-645521549 [1] https://lab.fedeproxy.eu/ceph/ceph/-/tree/wip-mempool-cacheline-49781
Great! Thank you :-)
On 25/04/2021 10:39, Nathan Cutler wrote:
On Sat, Apr 24, 2021 at 11:13:39PM +0200, Loïc Dachary wrote:
Thanks for pushing the branch. I amended it a little and the teuthology run now passes[0]. There are still issues, I'm sure, but it's
On 25/04/2021 17:10, Loïc Dachary wrote: probably good enough for a pull request. Would you be so kind as to create one based on my branch[1] with the following cover? Thanks a again for your help
:-)
Sure, here you go:
_______________________________________________ Dev mailing list -- dev@ceph.io To unsubscribe send an email to dev-leave@ceph.io
-- Loïc Dachary, Artisan Logiciel Libre _______________________________________________ Dev mailing list -- dev@ceph.io To unsubscribe send an email to dev-leave@ceph.io
-- Regards Kefu Chai
Hi Kefu, On 29/04/2021 18:14, kefu chai wrote:
Loïc Dachary <loic@dachary.org <mailto:loic@dachary.org>>于2021年4月28日 周三18:12写道:
Hi Nathan,
Josh noticed that one line could be removed[0] from the test script. I did it and repushed[1]. Would you be so kind as to push the change to GitHub?
Loïc and Nathan, when testing the change, I ran into an error like:
Traceback (most recent call last): File "/home/kchai/teuthology/virtualenv/bin/teuthology-suite", line 33, in <module> sys.exit(load_entry_point('teuthology', 'console_scripts', 'teuthology-suite')()) File "/home/kchai/teuthology/scripts/suite.py", line 189, in main return teuthology.suite.main(args) File "/home/kchai/teuthology/teuthology/suite/__init__.py", line
143, in main
run.prepare_and_schedule() File "/home/kchai/teuthology/teuthology/suite/run.py", line 397, in prepare_and_schedule num_jobs = self.schedule_suite() File "/home/kchai/teuthology/teuthology/suite/run.py", line 615, in schedule_suite self.args.newest, job_limit) File "/home/kchai/teuthology/teuthology/suite/run.py", line 467, in collect_jobs self.package_versions File "/home/kchai/teuthology/teuthology/suite/util.py", line 394, in get_package_versions distro_version=os_version, File "/home/kchai/teuthology/teuthology/suite/util.py", line 274, in package_version_for_hash sha1=hash, File "/home/kchai/teuthology/teuthology/packaging.py", line 853, in __init__ super(ShamanProject, self).__init__(project, job_config, ctx, remote) File "/home/kchai/teuthology/teuthology/packaging.py", line 462, in __init__ self._init_from_config() File "/home/kchai/teuthology/teuthology/packaging.py", line 497, in _init_from_config OS.version_codename(self.os_type, self.os_version) File "/home/kchai/teuthology/teuthology/orchestra/opsys.py", line 200, in version_codename (version_or_codename, name)) KeyError: '8.3 not a ubuntu version or codename'
I think the root cause is that the rados/standalone test suite includes it’s own faces for choosing a random distro, and my test happened to pick rhel 8.3 for testing, but the distro name was overridden by the one specified by c2c.yaml. That’s why I had a combination of Ubuntu 8.3. I just took the liberty to push another commit to the pull request in hope to test sooner. If it looks sane to you, could you include it in your commit? Or I can do this with your permission. This is perfect! I had doubts about running this against something other than Ubuntu and was not sure which package to include. You have my permission (and gratitude) to squash the commits together.
Cheers
Thanks for your help!
[0] https://github.com/ceph/ceph/pull/41014#pullrequestreview-645521549 <https://github.com/ceph/ceph/pull/41014#pullrequestreview-645521549> [1] https://lab.fedeproxy.eu/ceph/ceph/-/tree/wip-mempool-cacheline-49781 <https://lab.fedeproxy.eu/ceph/ceph/-/tree/wip-mempool-cacheline-49781>
On 25/04/2021 17:10, Loïc Dachary wrote: > Great! Thank you :-) > > On 25/04/2021 10:39, Nathan Cutler wrote: >> On Sat, Apr 24, 2021 at 11:13:39PM +0200, Loïc Dachary wrote: >>> Thanks for pushing the branch. I amended it a little and the teuthology run now passes[0]. There are still issues, I'm sure, but it's probably good enough for a pull request. Would you be so kind as to create one based on my branch[1] with the following cover? Thanks a again for your help > :-) >> Sure, here you go: >> >> https://github.com/ceph/ceph/pull/41014 <https://github.com/ceph/ceph/pull/41014> > > _______________________________________________ > Dev mailing list -- dev@ceph.io <mailto:dev@ceph.io> > To unsubscribe send an email to dev-leave@ceph.io <mailto:dev-leave@ceph.io>
-- Loïc Dachary, Artisan Logiciel Libre _______________________________________________ Dev mailing list -- dev@ceph.io <mailto:dev@ceph.io> To unsubscribe send an email to dev-leave@ceph.io <mailto:dev-leave@ceph.io>
-- Regards Kefu Chai
-- Loïc Dachary, Artisan Logiciel Libre
Hi Joe, With Josh, Kefu & Nathan's help the minimal c2c test is now in Ceph[0] and runs on CentOS, RHEL & Ubuntu. It will help catch regressions and diagnose them: thanks a lot for your invaluable help in making this happen. The next, more ambitious, step is to run c2c on a Ceph cluster under load and analyze the output of "perf c2c" to figure out if and how cacheline contention can be optimized. Cheers [0] https://github.com/ceph/ceph/pull/41014/files On 29/04/2021 18:23, Loïc Dachary wrote:
Hi Kefu,
On 29/04/2021 18:14, kefu chai wrote:
Loïc Dachary <loic@dachary.org <mailto:loic@dachary.org>>于2021年4月28日 周三18:12写道:
Hi Nathan,
Josh noticed that one line could be removed[0] from the test script. I did it and repushed[1]. Would you be so kind as to push the change to GitHub?
Loïc and Nathan, when testing the change, I ran into an error like:
Traceback (most recent call last): File "/home/kchai/teuthology/virtualenv/bin/teuthology-suite", line 33, in <module> sys.exit(load_entry_point('teuthology', 'console_scripts', 'teuthology-suite')()) File "/home/kchai/teuthology/scripts/suite.py", line 189, in main return teuthology.suite.main(args) File "/home/kchai/teuthology/teuthology/suite/__init__.py", line
143, in main
run.prepare_and_schedule() File "/home/kchai/teuthology/teuthology/suite/run.py", line 397, in prepare_and_schedule num_jobs = self.schedule_suite() File "/home/kchai/teuthology/teuthology/suite/run.py", line 615, in schedule_suite self.args.newest, job_limit) File "/home/kchai/teuthology/teuthology/suite/run.py", line 467, in collect_jobs self.package_versions File "/home/kchai/teuthology/teuthology/suite/util.py", line 394, in get_package_versions distro_version=os_version, File "/home/kchai/teuthology/teuthology/suite/util.py", line 274, in package_version_for_hash sha1=hash, File "/home/kchai/teuthology/teuthology/packaging.py", line 853, in __init__ super(ShamanProject, self).__init__(project, job_config, ctx, remote) File "/home/kchai/teuthology/teuthology/packaging.py", line 462, in __init__ self._init_from_config() File "/home/kchai/teuthology/teuthology/packaging.py", line 497, in _init_from_config OS.version_codename(self.os_type, self.os_version) File "/home/kchai/teuthology/teuthology/orchestra/opsys.py", line 200, in version_codename (version_or_codename, name)) KeyError: '8.3 not a ubuntu version or codename'
I think the root cause is that the rados/standalone test suite includes it’s own faces for choosing a random distro, and my test happened to pick rhel 8.3 for testing, but the distro name was overridden by the one specified by c2c.yaml. That’s why I had a combination of Ubuntu 8.3. I just took the liberty to push another commit to the pull request in hope to test sooner. If it looks sane to you, could you include it in your commit? Or I can do this with your permission. This is perfect! I had doubts about running this against something other than Ubuntu and was not sure which package to include. You have my permission (and gratitude) to squash the commits together.
Cheers
Thanks for your help!
[0] https://github.com/ceph/ceph/pull/41014#pullrequestreview-645521549 <https://github.com/ceph/ceph/pull/41014#pullrequestreview-645521549> [1] https://lab.fedeproxy.eu/ceph/ceph/-/tree/wip-mempool-cacheline-49781 <https://lab.fedeproxy.eu/ceph/ceph/-/tree/wip-mempool-cacheline-49781>
On 25/04/2021 17:10, Loïc Dachary wrote: > Great! Thank you :-) > > On 25/04/2021 10:39, Nathan Cutler wrote: >> On Sat, Apr 24, 2021 at 11:13:39PM +0200, Loïc Dachary wrote: >>> Thanks for pushing the branch. I amended it a little and the teuthology run now passes[0]. There are still issues, I'm sure, but it's probably good enough for a pull request. Would you be so kind as to create one based on my branch[1] with the following cover? Thanks a again for your help > :-) >> Sure, here you go: >> >> https://github.com/ceph/ceph/pull/41014 <https://github.com/ceph/ceph/pull/41014> > > _______________________________________________ > Dev mailing list -- dev@ceph.io <mailto:dev@ceph.io> > To unsubscribe send an email to dev-leave@ceph.io <mailto:dev-leave@ceph.io>
-- Loïc Dachary, Artisan Logiciel Libre _______________________________________________ Dev mailing list -- dev@ceph.io <mailto:dev@ceph.io> To unsubscribe send an email to dev-leave@ceph.io <mailto:dev-leave@ceph.io>
-- Regards Kefu Chai
_______________________________________________ Dev mailing list -- dev@ceph.io To unsubscribe send an email to dev-leave@ceph.io
-- Loïc Dachary, Artisan Logiciel Libre
Hi Loïc: Great to see this is moving forward. A few questions and comments: 1) I do see the test code measuring the runtime differences between the sharding and non-sharding cases. Were you going to add test code to analyze the output of the perf c2c runs (for hottest cachelines and long load latencies). That can be challenging to figure out how to do it effectively, given all the variables involved with different test environments. 2) Is there a check to verify the test is being run on an Intel based system? 3) I see the comment in the mempool.h file: // Align shard to a cacheline. // // It would be possible to retrieve the value at runtime (for instance // with getconf LEVEL1_DCACHE_LINESIZE or grep -m1 cache_alignment // /proc/cpuinfo). It is easier to hard code the largest cache // linesize for all known processors (128 bytes). If the actual cache // linesize is smaller on a given processor, it will just waste a few // bytes. // The above is slightly incorrect about wasting a few bytes. On Intel platforms where the cacheline size is 64 bytes, it's smart to pad your hot locks out to 128 bytes. (I briefly mentioned this earlier.) The reason is because of the hardware prefetchers. When the prefetchers fetch a cacheline, they anticipate your program will also need the next cacheline, so they gratuitously fetch that one as well. They load 128 bytes instead of the requested 64 bytes. If that next cacheine is in a critical code path, any users of that line will have their cacheline copy marked invalid because the prefetchers for the earlier cacheline just overwrote it. The performance problems we see from this are rare, but are real and are difficult to diagnose. The Linux kernel and some big database vendors pad all their hot locks and variables out to 128 bytes just for this reason. 4) I see the test code retained all the commands I put into the c2c.sh file so that I could understand what the system environment was like. You only need to keep them and the kernel perf c2c commands if you feel you need them. Nice to see this work is happening. Thanks, Joe On Fri, Apr 30, 2021 at 10:04 AM Loïc Dachary <loic@dachary.org> wrote:
Hi Joe,
With Josh, Kefu & Nathan's help the minimal c2c test is now in Ceph[0] and runs on CentOS, RHEL & Ubuntu. It will help catch regressions and diagnose them: thanks a lot for your invaluable help in making this happen. The next, more ambitious, step is to run c2c on a Ceph cluster under load and analyze the output of "perf c2c" to figure out if and how cacheline contention can be optimized.
Cheers
[0] https://github.com/ceph/ceph/pull/41014/files
Hi Kefu,
On 29/04/2021 18:14, kefu chai wrote:
Loïc Dachary <loic@dachary.org <mailto:loic@dachary.org>>于2021年4月28日
周三18:12写道:
Hi Nathan,
Josh noticed that one line could be removed[0] from the test
Loïc and Nathan, when testing the change, I ran into an error like:
Traceback (most recent call last): File "/home/kchai/teuthology/virtualenv/bin/teuthology-suite", line
33, in <module>
sys.exit(load_entry_point('teuthology', 'console_scripts',
'teuthology-suite')())
File "/home/kchai/teuthology/scripts/suite.py", line 189, in main return teuthology.suite.main(args) File "/home/kchai/teuthology/teuthology/suite/__init__.py", line 143, in main run.prepare_and_schedule() File "/home/kchai/teuthology/teuthology/suite/run.py", line 397, in prepare_and_schedule num_jobs = self.schedule_suite() File "/home/kchai/teuthology/teuthology/suite/run.py", line 615, in schedule_suite self.args.newest, job_limit) File "/home/kchai/teuthology/teuthology/suite/run.py", line 467, in collect_jobs self.package_versions File "/home/kchai/teuthology/teuthology/suite/util.py", line 394, in get_package_versions distro_version=os_version, File "/home/kchai/teuthology/teuthology/suite/util.py", line 274, in
sha1=hash, File "/home/kchai/teuthology/teuthology/packaging.py", line 853,
in __init__
super(ShamanProject, self).__init__(project, job_config, ctx,
remote)
File "/home/kchai/teuthology/teuthology/packaging.py", line 462, in __init__ self._init_from_config() File "/home/kchai/teuthology/teuthology/packaging.py", line 497, in _init_from_config OS.version_codename(self.os_type, self.os_version) File "/home/kchai/teuthology/teuthology/orchestra/opsys.py", line 200, in version_codename (version_or_codename, name)) KeyError: '8.3 not a ubuntu version or codename'
I think the root cause is that the rados/standalone test suite includes it’s own faces for choosing a random distro, and my test happened to pick rhel 8.3 for testing, but the distro name was overridden by the one specified by c2c.yaml. That’s why I had a combination of Ubuntu 8.3. I just took the liberty to push another commit to the pull request in hope to test sooner. If it looks sane to you, could you include it in your commit? Or I can do this with your permission. This is perfect! I had doubts about running this against something other
On 29/04/2021 18:23, Loïc Dachary wrote: script. I did it and repushed[1]. Would you be so kind as to push the change to GitHub? package_version_for_hash than Ubuntu and was not sure which package to include. You have my permission (and gratitude) to squash the commits together.
Cheers
Thanks for your help!
[0]
[1]
https://lab.fedeproxy.eu/ceph/ceph/-/tree/wip-mempool-cacheline-49781 < https://lab.fedeproxy.eu/ceph/ceph/-/tree/wip-mempool-cacheline-49781>
On 25/04/2021 17:10, Loïc Dachary wrote: > Great! Thank you :-) > > On 25/04/2021 10:39, Nathan Cutler wrote: >> On Sat, Apr 24, 2021 at 11:13:39PM +0200, Loïc Dachary wrote: >>> Thanks for pushing the branch. I amended it a little and the
teuthology run now passes[0]. There are still issues, I'm sure, but it's
https://github.com/ceph/ceph/pull/41014#pullrequestreview-645521549 < https://github.com/ceph/ceph/pull/41014#pullrequestreview-645521549> probably good enough for a pull request. Would you be so kind as to create one based on my branch[1] with the following cover? Thanks a again for your help
> :-) >> Sure, here you go: >> >> https://github.com/ceph/ceph/pull/41014 <
https://github.com/ceph/ceph/pull/41014>
> > _______________________________________________ > Dev mailing list -- dev@ceph.io <mailto:dev@ceph.io> > To unsubscribe send an email to dev-leave@ceph.io <mailto:
dev-leave@ceph.io>
-- Loïc Dachary, Artisan Logiciel Libre _______________________________________________ Dev mailing list -- dev@ceph.io <mailto:dev@ceph.io> To unsubscribe send an email to dev-leave@ceph.io <mailto:
dev-leave@ceph.io>
-- Regards Kefu Chai
_______________________________________________ Dev mailing list -- dev@ceph.io To unsubscribe send an email to dev-leave@ceph.io
-- Loïc Dachary, Artisan Logiciel Libre
Hi Joe, You remember correctly: I had ideas to refine the tests further and would have done so if the review phase had been longer. But it went faster than I expected, which is a good thing :-) The important part (guarding against regressions) is merged and the improvements can be added later. Cheers On 30/04/2021 17:16, Joe Mario wrote:
Hi Loïc: Great to see this is moving forward. A few questions and comments:
1) I do see the test code measuring the runtime differences between the sharding and non-sharding cases. Were you going to add test code to analyze the output of the perf c2c runs (for hottest cachelines and long load latencies). That can be challenging to figure out how to do it effectively, given all the variables involved with different test environments.
2) Is there a check to verify the test is being run on an Intel based system?
3) I see the comment in the mempool.h file:
// Align shard to a cacheline. // // It would be possible to retrieve the value at runtime (for instance // with getconf LEVEL1_DCACHE_LINESIZE or grep -m1 cache_alignment // /proc/cpuinfo). It is easier to hard code the largest cache // linesize for all known processors (128 bytes). If the actual cache // linesize is smaller on a given processor, it will just waste a few // bytes. // The above is slightly incorrect about wasting a few bytes. On Intel platforms where the cacheline size is 64 bytes, it's smart to pad your hot locks out to 128 bytes. (I briefly mentioned this earlier.) The reason is because of the hardware prefetchers. When the prefetchers fetch a cacheline, they anticipate your program will also need the next cacheline, so they gratuitously fetch that one as well. They load 128 bytes instead of the requested 64 bytes. If that next cacheine is in a critical code path, any users of that line will have their cacheline copy marked invalid because the prefetchers for the earlier cacheline just overwrote it.
The performance problems we see from this are rare, but are real and are difficult to diagnose. The Linux kernel and some big database vendors pad all their hot locks and variables out to 128 bytes just for this reason.
4) I see the test code retained all the commands I put into the c2c.sh file so that I could understand what the system environment was like. You only need to keep them and the kernel perf c2c commands if you feel you need them.
Nice to see this work is happening. Thanks, Joe
On Fri, Apr 30, 2021 at 10:04 AMLoïc Dachary <loic@dachary.org <mailto:loic@dachary.org>> wrote:
Hi Joe,
With Josh, Kefu & Nathan's help the minimal c2c test is now in Ceph[0] and runs on CentOS, RHEL & Ubuntu. It will help catch regressions and diagnose them: thanks a lot for your invaluable help in making this happen. The next, more ambitious, step is to run c2c on a Ceph cluster under load and analyze the output of "perf c2c" to figure out if and how cacheline contention can be optimized.
Cheers
[0] https://github.com/ceph/ceph/pull/41014/files <https://github.com/ceph/ceph/pull/41014/files>
On 29/04/2021 18:23, Loïc Dachary wrote: > Hi Kefu, > > On 29/04/2021 18:14, kefu chai wrote: >> >> >> Loïc Dachary <loic@dachary.org <mailto:loic@dachary.org> <mailto:loic@dachary.org <mailto:loic@dachary.org>>>于2021年4月28日 周三18:12写道: >> >> Hi Nathan, >> >> Josh noticed that one line could be removed[0] from the test script. I did it and repushed[1]. Would you be so kind as to push the change to GitHub? >> >> >> Loïc and Nathan, when testing the change, I ran into an error like: >> >> Traceback (most recent call last): >> File "/home/kchai/teuthology/virtualenv/bin/teuthology-suite", line 33, in <module> >> sys.exit(load_entry_point('teuthology', 'console_scripts', 'teuthology-suite')()) >> File "/home/kchai/teuthology/scripts/suite.py", line 189, in main >> return teuthology.suite.main(args) >> File "/home/kchai/teuthology/teuthology/suite/__init__.py", line > 143, in main >> run.prepare_and_schedule() >> File "/home/kchai/teuthology/teuthology/suite/run.py", line 397, > in prepare_and_schedule >> num_jobs = self.schedule_suite() >> File "/home/kchai/teuthology/teuthology/suite/run.py", line 615, > in schedule_suite >> self.args.newest, job_limit) >> File "/home/kchai/teuthology/teuthology/suite/run.py", line 467, > in collect_jobs >> self.package_versions >> File "/home/kchai/teuthology/teuthology/suite/util.py", line 394, in get_package_versions >> distro_version=os_version, >> File "/home/kchai/teuthology/teuthology/suite/util.py", line 274, in package_version_for_hash >> sha1=hash, >> File "/home/kchai/teuthology/teuthology/packaging.py", line 853, > in __init__ >> super(ShamanProject, self).__init__(project, job_config, ctx, remote) >> File "/home/kchai/teuthology/teuthology/packaging.py", line 462, > in __init__ >> self._init_from_config() >> File "/home/kchai/teuthology/teuthology/packaging.py", line 497, > in _init_from_config >> OS.version_codename(self.os_type, self.os_version) >> File "/home/kchai/teuthology/teuthology/orchestra/opsys.py", line 200, in version_codename >> (version_or_codename, name)) >> KeyError: '8.3 not a ubuntu version or codename' >> >> I think the root cause is that the rados/standalone test suite includes > it’s own faces for choosing a random distro, and my test happened > to pick rhel 8.3 for testing, but the distro name was overridden by the one specified by c2c.yaml. That’s why I had a combination of Ubuntu 8.3. I just took the liberty to push another commit to the pull request > in hope to test sooner. If it looks sane to you, could you include it in your commit? Or I can do this with your permission. > This is perfect! I had doubts about running this against something other than Ubuntu and was not sure which package to include. You have my permission (and gratitude) to squash the commits together. > > Cheers >> >> >> >> Thanks for your help! >> >> [0] https://github.com/ceph/ceph/pull/41014#pullrequestreview-645521549 <https://github.com/ceph/ceph/pull/41014#pullrequestreview-645521549> <https://github.com/ceph/ceph/pull/41014#pullrequestreview-645521549 <https://github.com/ceph/ceph/pull/41014#pullrequestreview-645521549>> >> [1] https://lab.fedeproxy.eu/ceph/ceph/-/tree/wip-mempool-cacheline-49781 <https://lab.fedeproxy.eu/ceph/ceph/-/tree/wip-mempool-cacheline-49781> <https://lab.fedeproxy.eu/ceph/ceph/-/tree/wip-mempool-cacheline-49781 <https://lab.fedeproxy.eu/ceph/ceph/-/tree/wip-mempool-cacheline-49781>> >> >> On 25/04/2021 17:10, Loïc Dachary wrote: >> > Great! Thank you :-) >> > >> > On 25/04/2021 10:39, Nathan Cutler wrote: >> >> On Sat, Apr 24, 2021 at 11:13:39PM +0200, Loïc Dachary wrote: >> >>> Thanks for pushing the branch. I amended it a little and the teuthology run now passes[0]. There are still issues, I'm sure, but it's probably good enough for a pull request. Would you be so kind as to create one based on my branch[1] with the following cover? Thanks a again for your help >> > :-) >> >> Sure, here you go: >> >> >> >> https://github.com/ceph/ceph/pull/41014 <https://github.com/ceph/ceph/pull/41014> <https://github.com/ceph/ceph/pull/41014 <https://github.com/ceph/ceph/pull/41014>> >> > >> > _______________________________________________ >> > Dev mailing list -- dev@ceph.io <mailto:dev@ceph.io> <mailto:dev@ceph.io <mailto:dev@ceph.io>> >> > To unsubscribe send an email to dev-leave@ceph.io <mailto:dev-leave@ceph.io> <mailto:dev-leave@ceph.io <mailto:dev-leave@ceph.io>> >> >> -- >> Loïc Dachary, Artisan Logiciel Libre >> _______________________________________________ >> Dev mailing list -- dev@ceph.io <mailto:dev@ceph.io> <mailto:dev@ceph.io <mailto:dev@ceph.io>> >> To unsubscribe send an email to dev-leave@ceph.io <mailto:dev-leave@ceph.io> <mailto:dev-leave@ceph.io <mailto:dev-leave@ceph.io>> >> >> -- >> Regards >> Kefu Chai > > > _______________________________________________ > Dev mailing list -- dev@ceph.io <mailto:dev@ceph.io> > To unsubscribe send an email to dev-leave@ceph.io <mailto:dev-leave@ceph.io> >
-- Loïc Dachary, Artisan Logiciel Libre
-- Loïc Dachary, Artisan Logiciel Libre
Hi Joe, The test program[0] was run with the commands you provided[1] and a 30 seconds "warm up" period. The output was uploaded to dropbox.redhat.com in a file named ceph-c2c-jmario-2021-04-04-16-28.tar.gz. There are two directories: * with-sharding is with the optimization turned on * without-sharding is without the optimization I took a quick look and saw a difference in the perf_c2c_a_all_user_phys_data.out files. Without the optimization there is only one line and with the optimization there are 8 (the number of threads). The interpretation of this difference is beyond me and I'm very curious to read what you make of it, as well as the rest of the output :-) A machine is dedicated to this test and doing nothing else. Now that it's ready I'll be able to adjust whatever you suggest the same day. Thanks again for your patience and willingness to share your expertise! Cheers [0] https://lab.fedeproxy.eu/ceph/ceph/-/blob/wip-mempool-cacheline-49781/src/te... [1] https://lab.fedeproxy.eu/ceph/ceph/-/blob/wip-mempool-cacheline-49781/qa/sta... ================================================ # # ----------- Cacheline ---------- Tot ------- Load Hitm ------- Total Total Total ---- Stores ---- ----- Core Load Hit ----- - LLC Load Hit -- - RMT Load Hit -- --- Load Dram ---- # Index Address Node PA cnt Hitm Total LclHitm RmtHitm records Loads Stores L1Hit L1Miss FB L1 L2 LclHit LclHitm RmtHit RmtHitm Lcl Rmt # ..... .................. .... ...... ....... ....... ....... ....... ....... ....... ....... ....... ....... ....... ....... ....... ........ ....... ........ ....... ........ ........ # 0 0x7fffff04c200 0 1 100.00% 35593 35593 0 140432 60712 79720 79720 0 0 25114 0 5 35593 0 0 0 0 ================================================= Shared Cache Line Distribution Pareto ================================================= # # ----- HITM ----- -- Store Refs -- --------- Data address --------- ---------- cycles ---------- Total cpu Shared # Num RmtHitm LclHitm L1 Hit L1 Miss Offset Node PA cnt Code address rmt hitm lcl hitm load records cnt Symbol Object Source:Line Node # ..... ....... ....... ....... ....... .................. .... ...... .................. ........ ........ ........ ....... ........ .............................. ............. ................. .... # ------------------------------------------------------------- 0 0 35593 79720 0 0x7fffff04c200 ------------------------------------------------------------- 0.00% 100.00% 100.00% 0.00% 0x30 0 1 0x55669fda67ba 0 550 450 140432 4 [.] std::__atomic_base<int>::o ceph_test_c2c atomic_base.h:548 0 ================================================= Shared Data Cache Line Table ================================================= # # ----------- Cacheline ---------- Tot ------- Load Hitm ------- Total Total Total ---- Stores ---- ----- Core Load Hit ----- - LLC Load Hit -- - RMT Load Hit -- --- Load Dram ---- # Index Address Node PA cnt Hitm Total LclHitm RmtHitm records Loads Stores L1Hit L1Miss FB L1 L2 LclHit LclHitm RmtHit RmtHitm Lcl Rmt # ..... .................. .... ...... ....... ....... ....... ....... ....... ....... ....... ....... ....... ....... ....... ....... ........ ....... ........ ....... ........ ........ # 0 0x7ffecdcb4700 0 71586 100.00% 22548 22548 0 84925 28141 56784 56784 0 0 5592 0 1 22548 0 0 0 0 ================================================= Shared Cache Line Distribution Pareto ================================================= # # ----- HITM ----- -- Store Refs -- --------- Data address --------- ---------- cycles ---------- Total cpu Shared # Num RmtHitm LclHitm L1 Hit L1 Miss Offset Node PA cnt Code address rmt hitm lcl hitm load records cnt Symbol Object Source:Line Node # ..... ....... ....... ....... ....... .................. .... ...... .................. ........ ........ ........ ....... ........ .............................. ............. ................. .... # ------------------------------------------------------------- 0 0 22548 56784 0 0x7ffecdcb4700 ------------------------------------------------------------- 0.00% 27.38% 15.11% 0.00% 0x0 0 1 0x55cc50aa67ba 0 274 289 16378 2 [.] std::__atomic_base<int>::o ceph_test_c2c atomic_base.h:548 0 0.00% 0.00% 14.67% 0.00% 0x4 0 1 0x55cc50aa67ba 0 0 0 8331 1 [.] std::__atomic_base<int>::o ceph_test_c2c atomic_base.h:548 0 0.00% 26.40% 15.26% 0.00% 0x8 0 1 0x55cc50aa67ba 0 279 289 16572 1 [.] std::__atomic_base<int>::o ceph_test_c2c atomic_base.h:548 0 0.00% 13.32% 14.72% 0.00% 0xc 0 1 0x55cc50aa67ba 0 548 406 11974 2 [.] std::__atomic_base<int>::o ceph_test_c2c atomic_base.h:548 0 0.00% 10.36% 12.93% 0.00% 0x10 0 1 0x55cc50aa67ba 0 423 299 10135 1 [.] std::__atomic_base<int>::o ceph_test_c2c atomic_base.h:548 0 0.00% 9.82% 12.42% 0.00% 0x14 0 1 0x55cc50aa67ba 0 407 288 9638 1 [.] std::__atomic_base<int>::o ceph_test_c2c atomic_base.h:548 0 0.00% 12.72% 14.89% 0.00% 0x18 0 1 0x55cc50aa67ba 0 546 410 11897 1 [.] std::__atomic_base<int>::o ceph_test_c2c atomic_base.h:548 0 On 18/03/2021 18:25, Loïc Dachary wrote:
Hi Joe,
I can't tell you how happy I am that you're around to help understand this :-) In the spirit of making baby steps to better understand what's going on, I'd like to run a small part of Ceph[0] that is designed to be optimized and avoid cacheline ping pong. The code running this part would be in a test (similar to an existing one[1]). It would be launched on a single Intel machine (as part of a teuthology run, the integration test tool specific to Ceph) and use the commands you suggest. After the first run I'll send the data to you for interpretation (sounds like consulting an oracle :-) ).
With your help I'm hoping the integration test will assert that running the mempool with the optimization is at least X% faster than without the optimization and fail otherwise. That would be very helpful to guard against accidental regressions.
Once this first goal is achieved, collecting data from a Ceph cluster running under load could follow the same methodology. I'm sure Mark Nelson will be most interested in this more ambitious target.
If I'm not mistaken, the commands (let say they are in a ceph-c2c.sh script) should be run like this:
* Run the software (be it mempool simulation or Ceph under load), let it warm up * Run ceph-c2c.sh (it won't take more than a minute or so to complete) * Collect the data and save them * Kill the software
Is that correct?
Cheers
[0] https://github.com/ceph/ceph/blob/2b21735498c98299d5ce383011c3dbe25aaee70f/s... [1] https://github.com/ceph/ceph/blob/2b21735498c98299d5ce383011c3dbe25aaee70f/s...
On 18/03/2021 16:40, jmario@redhat.com wrote:
Hi Loïc, Per our email discussion, I'm happy to help. If you or anyone else can run perf c2c, I will analyze the results and reply back with the findings.
The perf c2c output is a bit non-intuitive, but it conveys a lot. I'm happy to share the findings.
Here's what I recommend: 1) Get on an Intel system where you're pushing Ceph really hard. (AMD uses different low level perf events that haven't been ported over yet.) 2) Make sure the Ceph code you're running has debug info in it and isn't stripped. 3) This needs to be run on bare-metal. The PEBS perf events used by c2c are not supported in a virtualized guest (Intel says support is coming in newer cpus). 3) As any fyi, the less cpu pinning you do, the more cacheline contention c2c will expose. 4) Once you run the commands that I've appended below (as root), then tar up everything, data files and all, and lftp them to the location below:
$ lftp dropbox.redhat.com > cd /incoming > put unique-filename
Please let me know the name of the files that you uploaded after you put them there. I'll grab them. I just joined this list and I don't know if I'll get notified of the replies, so send me email when the files are there for me to grab.
Does that sound OK? Holler if you have any questions. Joe
# First get some background system info uname -a > uname.out lscpu > lscpu.out cat /proc/cmdline > cmdline.out timeout -s INT 10 vmstat -w 1 > vmstat.out
nodecnt=`lscpu|grep "NUMA node(" |awk '{print $3}'` for ((i=0; i<$nodecnt; i++)) do cat /sys/devices/system/node/node${i}/meminfo > meminfo.$i.out done more `find /proc -name status` > proc_parent_child_status.out more /proc/*/numa_maps > numa_maps.out
# # Get separate kernel and user perf-c2c stats # perf c2c record -a --ldlat=70 --all-user -o perf_c2c_a_all_user.data sleep 5 perf c2c report --stdio -i perf_c2c_a_all_user.data > perf_c2c_a_all_user.out 2>&1 perf c2c report --full-symbols --stdio -i perf_c2c_a_all_user.data > perf_c2c_full-sym_a_all_user.out 2>&1
perf c2c record -g -a --ldlat=70 --all-user -o perf_c2c_g_a_all_user.data sleep 5 perf c2c report -g --stdio -i perf_c2c_g_a_all_user.data > perf_c2c_g_a_all_user.out 2>&1
perf c2c record -a --ldlat=70 --all-kernel -o perf_c2c_a_all_kernel.data sleep 4 perf c2c report --stdio -i perf_c2c_a_all_kernel.data > perf_c2c_a_all_kernel.out 2>&1
perf c2c record -g --ldlat=70 -a --all-kernel -o perf_c2c_g_a_all_kernel.data sleep 4 perf c2c report -g --stdio -i perf_c2c_g_a_all_kernel.data > perf_c2c_g_a_all_kernel.out 2>&1
# # Get combined kernel and user perf-c2c stats # perf c2c record -a --ldlat=70 -o perf_c2c_a_both.data sleep 4 perf c2c report --stdio -i perf_c2c_a_both.data > perf_c2c_a_both.out 2>&1
perf c2c record -g --ldlat=70 -a --all-kernel -o perf_c2c_g_a_both.data sleep 4 perf c2c report -g --stdio -i perf_c2c_g_a_both.data > perf_c2c_g_a_both.out 2>&1
# # Get all-user physical addr stats, in case multiple threads or processes are # accessing shared memory with different vaddrs. # perf c2c record --phys-data -a --ldlat=70 --all-user -o perf_c2c_a_all_user_phys_data.data sleep 5 perf c2c report --stdio -i perf_c2c_a_all_user_phys_data.data > perf_c2c_a_all_user_phys_data.out 2>&1 _______________________________________________ Dev mailing list -- dev@ceph.io To unsubscribe send an email to dev-leave@ceph.io
-- Loïc Dachary, Artisan Logiciel Libre
Hi Loïc: I just took a quick look, was surprised to see no contention, and then realized that this was done on an AMD server. AMD never added their support for the low level perf events that are similar to Intel's PEBS events. The AMD cpus do have those similar features, and we've talked with them about getting them added to the perf tool, but so far we've not seen it. I'm sorry if I didn't stress the "Intel" piece strongly enough. Can you find an Intel server to rerun this test? Any Intel server in the last 10 years (Ivy Bridge or newer) should work. However for this testing, the newer and faster the server is, the more pronounced the contention will be. So if you can get on a Cascade Lake or Skylake server, that would be best. Joe
Hi Joe, /proc/cpuinfo reads: model name : Intel(R) Core(TM) i7-7600U CPU @ 2.80GHz running: Linux enough 5.10.0-5-amd64 #1 SMP Debian 5.10.24-1 (2021-03-19) x86_64 GNU/Linux I'm not sure why the tests confused it with an AMD though. Do you ? It is *not* a server though: it is a laptop that I wiped out and reinstalled from scratch to use it for the duration of the test with no interference. Are laptops somehow immune to the problem? Cheers On 04/04/2021 17:12, jmario@redhat.com wrote:
Hi Loïc: I just took a quick look, was surprised to see no contention, and then realized that this was done on an AMD server. AMD never added their support for the low level perf events that are similar to Intel's PEBS events. The AMD cpus do have those similar features, and we've talked with them about getting them added to the perf tool, but so far we've not seen it.
I'm sorry if I didn't stress the "Intel" piece strongly enough.
Can you find an Intel server to rerun this test? Any Intel server in the last 10 years (Ivy Bridge or newer) should work. However for this testing, the newer and faster the server is, the more pronounced the contention will be. So if you can get on a Cascade Lake or Skylake server, that would be best.
Joe _______________________________________________ Dev mailing list -- dev@ceph.io To unsubscribe send an email to dev-leave@ceph.io
-- Loïc Dachary, Artisan Logiciel Libre
Hi Loic: A little more clarification, as I dug in deeper. I was wrong on the cpu type. It is an Intel cpu. But led me astray was the uname and the /proc/cmdline: uname: Linux enough 5.10.0-5-amd64 #1 SMP Debian 5.10.24-1 (2021-03-19) x86_64 GNU/Linux /proc/cmdline: BOOT_IMAGE=/vmlinuz-5.10.0-5-amd64 root=/dev/mapper/enough--vg-root ro quiet But looking at the lscpu, I do see it's an Intel cpu. (Sorry for not looking at that first before sent my earlier reply.) It appears the Debian amd64 kernel does not support the perf events needed for this. Is it possible for you to run this on a recent CentOS-8 OS version? I also see the system you used is a small, desktop level system with only 4 cpus (2 cores). If you can get a larger server, you should see more contention, which would help with this effort. Thanks, Joe
Hi Loic:
it is a laptop that I wiped out and reinstalled from scratch to use it for the duration of the test with no interference. Are laptops somehow immune to the problem?
Laptops are not immune to cacheline contention, but in my experience larger systems, with more cpus creates a better environment to see the contention. With more threads of execution (OSDs?) running on more cpus, the cacheline contention and tugging shows up much better. I was under the impression that those larger environments are similar to what Ceph is running in today where you're trying to minimize that contention. We can try it first on your laptop if that's all you have, and we'll see what it shows us. (But do try CentOS-8 instead of Debian). Do you want to go that route first? Jore
On 04/04/2021 17:46, jmario@redhat.com wrote:
Hi Loic: A little more clarification, as I dug in deeper.
I was wrong on the cpu type. It is an Intel cpu. But led me astray was the uname and the /proc/cmdline: uname: Linux enough 5.10.0-5-amd64 #1 SMP Debian 5.10.24-1 (2021-03-19) x86_64 GNU/Linux /proc/cmdline: BOOT_IMAGE=/vmlinuz-5.10.0-5-amd64 root=/dev/mapper/enough--vg-root ro quiet
But looking at the lscpu, I do see it's an Intel cpu. (Sorry for not looking at that first before sent my earlier reply.) I'm relieved.
It appears the Debian amd64 kernel does not support the perf events needed for this.
Is it possible for you to run this on a recent CentOS-8 OS version? Is there a simple way to verify that the kernel has support for perf events ? I'd like to try Ubuntu because it's been a while since I installed a CentOS. I also see the system you used is a small, desktop level system with only 4 cpus (2 cores). If you can get a larger server, you should see more contention, which would help with this effort. Yes, once the tests are ready I'll run them on an Intel server with 128 CPU :-)
Thanks, Joe _______________________________________________ Dev mailing list -- dev@ceph.io To unsubscribe send an email to dev-leave@ceph.io
-- Loïc Dachary, Artisan Logiciel Libre
I uploaded the /boot/config-5.10.0-5-amd64 file to dropbox.redhat.com : it looks like perf is compiled in: # # Kernel Performance Events And Counters # CONFIG_PERF_EVENTS=y and all the options below are =y (no =n). Maybe a module should be loaded ? On 04/04/2021 17:54, Loïc Dachary wrote:
On 04/04/2021 17:46, jmario@redhat.com wrote:
Hi Loic: A little more clarification, as I dug in deeper.
I was wrong on the cpu type. It is an Intel cpu. But led me astray was the uname and the /proc/cmdline: uname: Linux enough 5.10.0-5-amd64 #1 SMP Debian 5.10.24-1 (2021-03-19) x86_64 GNU/Linux /proc/cmdline: BOOT_IMAGE=/vmlinuz-5.10.0-5-amd64 root=/dev/mapper/enough--vg-root ro quiet
But looking at the lscpu, I do see it's an Intel cpu. (Sorry for not looking at that first before sent my earlier reply.) I'm relieved. It appears the Debian amd64 kernel does not support the perf events needed for this.
Is it possible for you to run this on a recent CentOS-8 OS version? Is there a simple way to verify that the kernel has support for perf events ? I'd like to try Ubuntu because it's been a while since I installed a CentOS. I also see the system you used is a small, desktop level system with only 4 cpus (2 cores). If you can get a larger server, you should see more contention, which would help with this effort. Yes, once the tests are ready I'll run them on an Intel server with 128 CPU :-) Thanks, Joe _______________________________________________ Dev mailing list -- dev@ceph.io To unsubscribe send an email to dev-leave@ceph.io
_______________________________________________ Dev mailing list -- dev@ceph.io To unsubscribe send an email to dev-leave@ceph.io
-- Loïc Dachary, Artisan Logiciel Libre
Hi Loïc: Looking further, there is something in those files. It's just one small cacheline, but there is something there. I guess I'm not used to seeing c2c being run on a laptop, nor am I used to seeing so few samples, or even so little in the kernel. And I apologize for my quick initial mistaken analysis. Here's what it looks like is happening. Correct me if I'm wrong. In your "without-sharding" version of Ceph, you had 8 threads in the ceph_test_c2c binary all contending for the same lock located at offset 0 in a cacheline. And then, in the "with-sharding" version of Ceph, you changed it so that each thread would act on its own copy of the 4-byte lock. Unfortunately, the "with-sharding" version likely didn't help, because all those 8 locks are packed into the same cacheline, with each lock being 4 bytes away from the last one. If that is true, then you need to rewrite the code such that all the locks are located by themselves in their own cacheline. Is the above assumption correct? Also, I'm going to update the "run_c2c_ceph.sh" script I gave you. The "-g" flag isn't working as it should (known issue). Joe On Sun, Apr 4, 2021 at 12:21 PM Loïc Dachary <loic@dachary.org> wrote:
I uploaded the /boot/config-5.10.0-5-amd64 file to dropbox.redhat.com : it looks like perf is compiled in:
# # Kernel Performance Events And Counters # CONFIG_PERF_EVENTS=y
and all the options below are =y (no =n).
Maybe a module should be loaded ?
On 04/04/2021 20:24, Joe Mario wrote:
Hi Loïc: Looking further, there is something in those files. It's just one small cacheline, but there is something there. I guess I'm not used to seeing c2c being run on a laptop, nor am I used to seeing so few samples, or even so little in the kernel. And I apologize for my quick initial mistaken analysis.
Here's what it looks like is happening. Correct me if I'm wrong.
In your "without-sharding" version of Ceph, you had 8 threads in the ceph_test_c2c binary all contending for the same lock located at offset 0 in a cacheline. And then, in the "with-sharding" version of Ceph, you changed it so that each thread would act on its own copy of the 4-byte lock.
Unfortunately, the "with-sharding" version likely didn't help, because all those 8 locks are packed into the same cacheline, with each lock being 4 bytes away from the last one. If that is true, then you need to rewrite the code such that all the locks are located by themselves in their own cacheline.
Is the above assumption correct? Yes, absolutely right. I changed the variable to be 128 bytes aligned[0], is it ok? Maybe there is a constant somewhere that provides this number (number of bytes to be "cache aligned") so it is not hard coded? The output is uploaded in ceph-c2c-jmario-2021-04-04-22-13.tar.gz and hopefully looks better.
[0] https://lab.fedeproxy.eu/ceph/ceph/-/commit/54f3a4d0ece0e817bf9308617040f8bb... P.S. no need to apologize: I'm grateful for the quick feedback on a Sunday :-)
Also, I'm going to update the "run_c2c_ceph.sh" script I gave you.
The "-g" flag isn't working as it should (known issue).
Joe
On Sun, Apr 4, 2021 at 12:21 PM Loïc Dachary <loic@dachary.org <mailto:loic@dachary.org>> wrote:
I uploaded the /boot/config-5.10.0-5-amd64 file to dropbox.redhat.com <http://dropbox.redhat.com> : it looks like perf is compiled in:
# # Kernel Performance Events And Counters # CONFIG_PERF_EVENTS=y
and all the options below are =y (no =n).
Maybe a module should be loaded ?
-- Loïc Dachary, Artisan Logiciel Libre
Hi Loïc: On Sun, Apr 4, 2021 at 4:14 PM Loïc Dachary <loic@dachary.org> wrote:
<snip>
Is the above assumption correct? Yes, absolutely right. I changed the variable to be 128 bytes aligned[0], is it ok? Maybe there is a constant somewhere that provides this number (number of bytes to be "cache aligned") so it is not hard coded?
Here are two ways you can get the cacheline size. One is by reading /sys/devices/system/cpu/cpu0/cache/index0/coherency_line_size Another is with: gcc -DLEVEL1_DCACHE_LINESIZE=`getconf LEVEL1_DCACHE_LINESIZE` ... Another is with: grep -m1 cache_alignment /proc/cpuinfo Most often it's 64 bytes. I believe the power cpus are 128 bytes. Itanium was 128 bytes. However, even on the X86 platforms where the cacheline size is 64 bytes, it's very often a good idea to pad your hot locks or hot data items out to 128 bytes (e.g. 2 cachelines instead of 1). The reason is this: By default when Intel processors fetch a cacheline of data, the cpu will gratuitously fetch the next cacheline, just in case you need it. However if that next cacheline is a different hot cacheline, the last thing you need is invalidate it with gratuitous writes. We have seen performance problems due to this, and the resolution was to pad the hot locks and variables out to 128 bytes. Some of the big database vendors pad out to 128 bytes because of this as well. I looked at the 2nd tar.gz file that you uploaded (ceph-c2c-jmario-2021-04-04-22-13.tar.gz ). As expected, the "without-sharding" case looked like it did earlier. However, in the "with-sharding" case, it didn't even look like your ceph_test_c2c program was even running. I even dumped the raw samples from the perf.data file and didn't see any loads or stores from the program. Can you double check that it ran correctly? Joe
Morning Joe, On 05/04/2021 02:15, Joe Mario wrote:
Hi Loïc:
On Sun, Apr 4, 2021 at 4:14 PM Loïc Dachary <loic@dachary.org <mailto:loic@dachary.org>> wrote:
<snip> > Is the above assumption correct? Yes, absolutely right. I changed the variable to be 128 bytes aligned[0], is it ok? Maybe there is a constant somewhere that provides this number (number of bytes to be "cache aligned") so it is not hard coded?
Here are two ways you can get the cacheline size. One is by reading /sys/devices/system/cpu/cpu0/cache/index0/coherency_line_size Another is with: gcc -DLEVEL1_DCACHE_LINESIZE=`getconf LEVEL1_DCACHE_LINESIZE` ... Another is with: grep -m1 cache_alignment /proc/cpuinfo
Most often it's 64 bytes. I believe the power cpus are 128 bytes. Itanium was 128 bytes.
However, even on the X86 platforms where the cacheline size is 64 bytes, it's very often a good idea to pad your hot locks or hot data items out
to 128 bytes (e.g. 2 cachelines instead of 1).
The reason is this: By default when Intel processors fetch a cacheline of data, the cpu will gratuitously fetch the next cacheline, just in case you need it. However if that next cacheline is a different hot cacheline, the last thing you need is invalidate it with gratuitous writes.
We have seen performance problems due to this, and the resolution was to pad the hot locks and variables out to 128 bytes. Some of the big database vendors pad out to 128 bytes because of this as well. Thanks for explaining: it makes sense now.
I looked at the 2nd tar.gz file that you uploaded (ceph-c2c-jmario-2021-04-04-22-13.tar.gz ). As expected, the "without-sharding" case looked like it did earlier. However, in the "with-sharding" case, it didn't even look like your ceph_test_c2c program was even running. I even dumped the raw samples from the perf.data file and didn't see any loads or stores from the program. Can you double check that it ran correctly? It did not run, indeed. The version with sharding is faster and it finished before the measures started. The first observable evidence of the optimization, exciting :-) I changed the test program so that it keeps running forever and will be killed by the caller when it is no longer needed.
The output was uploaded in ceph-c2c-jmario-2021-04-05-09-26.tar.gz Cheers -- Loïc Dachary, Artisan Logiciel Libre
The version with sharding to avoid cacheline contention is indeed faster (about 5 times faster). I modified the test program to verify that it is consistently at least 2x faster. This is deliberately conservative: the goal is to guard against a regression that would break the optimization entirely rather than trying to fine tune the optimization. There was such a regression in Ceph for a long time (fixed earlier this year) and it would be good if it does not happen again. In addition the test should also verify that the optimization actually relates to cacheline contention. If I understand correctly, the latest output I sent you shows that the non optimized version uses only one variable and there is a cacheline contention reported by perf. c2c The optimized version however has no cacheline contention at all, which is the intended effect of the optimization. Is my reasoning correct so far? On 05/04/2021 09:27, Loïc Dachary wrote:
Morning Joe,
On 05/04/2021 02:15, Joe Mario wrote:
Hi Loïc:
On Sun, Apr 4, 2021 at 4:14 PM Loïc Dachary <loic@dachary.org <mailto:loic@dachary.org>> wrote:
<snip> > Is the above assumption correct? Yes, absolutely right. I changed the variable to be 128 bytes aligned[0], is it ok? Maybe there is a constant somewhere that provides this number (number of bytes to be "cache aligned") so it is not hard coded?
Here are two ways you can get the cacheline size. One is by reading /sys/devices/system/cpu/cpu0/cache/index0/coherency_line_size Another is with: gcc -DLEVEL1_DCACHE_LINESIZE=`getconf LEVEL1_DCACHE_LINESIZE` ... Another is with: grep -m1 cache_alignment /proc/cpuinfo
Most often it's 64 bytes. I believe the power cpus are 128 bytes. Itanium was 128 bytes.
However, even on the X86 platforms where the cacheline size is 64 bytes, it's very often a good idea to pad your hot locks or hot data items out to 128 bytes (e.g. 2 cachelines instead of 1). The reason is this: By default when Intel processors fetch a cacheline of data, the cpu will gratuitously fetch the next cacheline, just in case you need it. However if that next cacheline is a different hot cacheline, the last thing you need is invalidate it with gratuitous writes.
We have seen performance problems due to this, and the resolution was to pad the hot locks and variables out to 128 bytes. Some of the big database vendors pad out to 128 bytes because of this as well. Thanks for explaining: it makes sense now. I looked at the 2nd tar.gz file that you uploaded (ceph-c2c-jmario-2021-04-04-22-13.tar.gz ). As expected, the "without-sharding" case looked like it did earlier. However, in the "with-sharding" case, it didn't even look like your ceph_test_c2c program was even running. I even dumped the raw samples from the perf.data file and didn't see any loads or stores from the program. Can you double check that it ran correctly? It did not run, indeed. The version with sharding is faster and it finished before the measures started. The first observable evidence of the optimization, exciting :-) I changed the test program so that it keeps running forever and will be killed by the caller when it is no longer needed.
The output was uploaded in ceph-c2c-jmario-2021-04-05-09-26.tar.gz
Cheers
_______________________________________________ Dev mailing list -- dev@ceph.io To unsubscribe send an email to dev-leave@ceph.io
-- Loïc Dachary, Artisan Logiciel Libre
And the commit with the benchmark test: https://lab.fedeproxy.eu/ceph/ceph/-/commit/b8ab6380adfc028da8166704dbc17552... On 05/04/2021 10:48, Loïc Dachary wrote:
The version with sharding to avoid cacheline contention is indeed faster (about 5 times faster). I modified the test program to verify that it is consistently at least 2x faster. This is deliberately conservative: the goal is to guard against a regression that would break the optimization entirely rather than trying to fine tune the optimization. There was such a regression in Ceph for a long time (fixed earlier this year) and it would be good if it does not happen again.
In addition the test should also verify that the optimization actually relates to cacheline contention. If I understand correctly, the latest output I sent you shows that the non optimized version uses only one variable and there is a cacheline contention reported by perf. c2c The optimized version however has no cacheline contention at all, which is the intended effect of the optimization.
Is my reasoning correct so far?
On 05/04/2021 09:27, Loïc Dachary wrote:
Morning Joe,
On 05/04/2021 02:15, Joe Mario wrote:
Hi Loïc:
On Sun, Apr 4, 2021 at 4:14 PM Loïc Dachary <loic@dachary.org <mailto:loic@dachary.org>> wrote:
<snip> > Is the above assumption correct? Yes, absolutely right. I changed the variable to be 128 bytes aligned[0], is it ok? Maybe there is a constant somewhere that provides this number (number of bytes to be "cache aligned") so it is not hard coded?
Here are two ways you can get the cacheline size. One is by reading /sys/devices/system/cpu/cpu0/cache/index0/coherency_line_size Another is with: gcc -DLEVEL1_DCACHE_LINESIZE=`getconf LEVEL1_DCACHE_LINESIZE` ... Another is with: grep -m1 cache_alignment /proc/cpuinfo
Most often it's 64 bytes. I believe the power cpus are 128 bytes. Itanium was 128 bytes.
However, even on the X86 platforms where the cacheline size is 64 bytes, it's very often a good idea to pad your hot locks or hot data items out to 128 bytes (e.g. 2 cachelines instead of 1). The reason is this: By default when Intel processors fetch a cacheline of data, the cpu will gratuitously fetch the next cacheline, just in case you need it. However if that next cacheline is a different hot cacheline, the last thing you need is invalidate it with gratuitous writes.
We have seen performance problems due to this, and the resolution was to pad the hot locks and variables out to 128 bytes. Some of the big database vendors pad out to 128 bytes because of this as well. Thanks for explaining: it makes sense now. I looked at the 2nd tar.gz file that you uploaded (ceph-c2c-jmario-2021-04-04-22-13.tar.gz ). As expected, the "without-sharding" case looked like it did earlier. However, in the "with-sharding" case, it didn't even look like your ceph_test_c2c program was even running. I even dumped the raw samples from the perf.data file and didn't see any loads or stores from the program. Can you double check that it ran correctly? It did not run, indeed. The version with sharding is faster and it finished before the measures started. The first observable evidence of the optimization, exciting :-) I changed the test program so that it keeps running forever and will be killed by the caller when it is no longer needed.
The output was uploaded in ceph-c2c-jmario-2021-04-05-09-26.tar.gz
Cheers
_______________________________________________ Dev mailing list -- dev@ceph.io To unsubscribe send an email to dev-leave@ceph.io
-- Loïc Dachary, Artisan Logiciel Libre
On Mon, Apr 5, 2021 at 3:27 AM Loïc Dachary <loic@dachary.org> wrote:
<SNIP> The version with sharding is faster and it finished before the measures started. The first observable evidence of the optimization, exciting :-) I changed the test program so that it keeps running forever and will be killed by the caller when it is no longer needed.
The output was uploaded in ceph-c2c-jmario-2021-04-05-09-26.tar.gz
Hi Loïc: Your new sharding version looks much better. I do not see any cacheline contention at all. Here's some insight into the difference. The atomic update you're doing to the lock-variable has to both read and write the lock-variable and does it while it has the cacheline for the lock-variable locked. The cpu doing that atomic instruction needs to first get ownership of the cacheline. If no other threads of execution are also trying to get ownership of that cacheline, then ownership is granted rather quickly. If, however, there are many other threads of execution trying to get ownership of that cacheline, then all those cpus must "get in line" and wait their turn. In your "without-sharding" case, the average number of machine cycles needed for the atomic instruction to gain ownership of the cacheline was 751 machine cycles. In the "with-sharding" case, it dropped to 84 machine cycles. Understand, however, the above numbers are not perfectly accurate. That's because perf was instructed to ignore any load instructions that took faster than 70 machine cycles to complete. The reasoning is at those low levels of machine cycles, there is no contention, so why burden the perf tool execution and data collection with the extra processing of fast loads that aren't relevant to finding cacheline contention. I mention this for completeness. The drop from 751 to 84 machine cycles is significant. Do you have something in your code to guarantee that nothing else resides in the same aligned "128 byte 2-cacheline block" as your locks? Joe
[snip]
Hi Loïc: Your new sharding version looks much better. I do not see any cacheline contention at all.
Here's some insight into the difference. The atomic update you're doing to the lock-variable has to both read and write the lock-variable and does it while it has the cacheline for the lock-variable locked.
The cpu doing that atomic instruction needs to first get ownership of the cacheline. If no other threads of execution are also trying to get ownership of that cacheline, then ownership is granted rather quickly. If, however, there are many other threads of execution trying to get ownership of that cacheline, then all those cpus must "get in line" and wait their turn.
In your "without-sharding" case, the average number of machine cycles needed for the atomic instruction to gain ownership of the cacheline was 751 machine cycles. In the "with-sharding" case, it dropped to 84 machine cycles.
Understand, however, the above numbers are not perfectly accurate. That's because perf was instructed to ignore any load instructions that took faster than 70 machine cycles to complete. The reasoning is at those low levels of machine cycles, there is no contention, so why burden
And if there are N CPUs and N*2 threads, the only way to avoid cacheline contention is if all of these threads use a different (cacheline aligned) variable. Is that correct? If it is correct, I wonder if cacheline contention has a linear impact on performances. If there is cacheline contention on 1 variable with N threads on N CPUS, will the performance degradation be the same if there is cacheline contention on 10 variables and the same number of threads & CPUS? Or will it get worse because there is some sort of amplification? the perf tool execution and data collection with the extra processing of fast loads that aren't relevant to finding cacheline contention. I mention this for completeness. The drop from 751 to 84 machine cycles is significant. Thanks for the crystal clear explanation. I'd like for the test script to extract those number from the files produced by perf c2c. How do you suggest I go about this?
Do you have something in your code to guarantee that nothing else resides in the same aligned "128 byte 2-cacheline block" as your locks?
These 128 bytes are not used, they are just padding to make sure nothing else is stored there. Cheers [0] https://lab.fedeproxy.eu/ceph/ceph/-/blob/wip-mempool-cacheline-49781/src/in...
On Mon, Apr 5, 2021 at 10:38 AM Loïc Dachary <loic@dachary.org> wrote: [snip]
The cpu doing that atomic instruction needs to first get ownership of the cacheline. If no other threads of execution are also trying to get ownership of that cacheline, then ownership is granted rather quickly. If, however, there are many other threads of execution trying to get ownership of that cacheline, then all those cpus must "get in line" and wait their turn.
And if there are N CPUs and N*2 threads, the only way to avoid cacheline contention is if all of these threads use a different (cacheline aligned) variable. Is that correct? If it is correct, I wonder if cacheline contention has a linear impact on performances. If there is cacheline contention on 1 variable with N threads on N CPUS, will the performance degradation be the same if there is cacheline contention on 10 variables and the same number of threads & CPUS? Or will it get worse because there is some sort of amplification?
In your test case, you avoided all cacheline contention by putting every lock into its own cacheline. In practice, however, multiple threads need to be contending for the same locks to modify shared data. The goal is to look at your application's hottest contended cachelines to see if that contention can be minimized. Some of the ways to do that include: 1) Seeing if the number of accesses to that line can be minimized, especially the writers. 2) Making sure multiple hot data variables don't share the same cacheline. 3) Looking to see if the accesses to the hot cachelines are coming from the same numa node as where the hot data lives. This isn't always possible, but it's good to examine it.
I'd like for the test script to extract those number from the files produced by perf c2c. How do you suggest I go about this?
Doing it for this test case was somewhat trivial, albeit fragile. That's because the "without-sharding" version only had one contended cacheline, and the "with-sharding" version had no contended cacheline. Because of that, I was able to dump the raw data and add up the load latencies for the test program's load instructions. The steps I used were: # perf script -i perf_c2c_a_all_user.data > t.script -f # grep ceph_test_c2c t.script |grep ldlat |sed -e 's/^.*LCK//' |awk '{s+=$2;c+=1}END {print s " " c " " s/c}' However the above simple script won't work when there's more than one hot cacheline involved. You can still find the data you want, it just gets more complicated. Plus, the real value in perf c2c is not just seeing the load latencies, but rather to learn everything about the contention which will then help guide how to minimize it. It provides a lot of insight into what's happening. How does this approach sound? 1) You set up Ceph to run on a bigger multi-node server with fast storage. 2) Run the attached script, which is just an updated version of the script you've been running. 3) Then we can set up a shared video call where I can walk you through the perf c2c output pointing out all the key pieces of information. 4) With the insight from "3" above, you can then decide what you might want to automate and how it might be done. Does that sound reasonable? See the attached "run_c2c_ceph2.sh" script. Joe
Hi Joe, I looked into perf script[0], trying to extract information related to the c2c test, in an attempt to make your " grep ceph_test_c2c t.script |grep ldlat |sed -e 's/^.*LCK//' |awk '{s+=$2;c+=1}END {print s " " c " " s/c}'" line more flexible. The first problem I had was to figure out which fields are displayed by default: the --fields does not say and there does not seem to be a way to show the field labels. I took a look at the sources[1] and while the beginning (command name, pid/tid, cpu) can be guessed easily, it becomes blurry towards the end of a line like: ceph_test_c2c 184970 [000] 617917.424796: 37057 cpu/mem-stores/P: 7ffcf821fef4 5080144 L1 hit|SNP N/A|TLB N/A|LCK N/A 0 55629c5f8708 [unknown] (/home/loic/ceph/build/bin/ceph_test_c2c) 5b4f81ef4 It looked like I could loose myself into this and did not investigate further. I did not followup on your suggestion to run perf on a running Ceph cluster either (sorry to disapoint :-( ) because I'd like to complete this simple task first. Trying to undertake anything more ambitious would be difficult. However! As you suggested I modified the test[2] with your new shell script and ran it on a real server (128 cores, 700+GB RAM). You will find the result in dropbox.redhat.com under the name ceph-c2c-jmario-2021-04-24-20-13.tar.gz. Hopefully they are consistent: I can't judge for myself because the content of the perf report is still quite mysterious. The metric I set is satisfied (optimization is at least twice faster) and it is good enough to propose this for integration in the Ceph test suite. The test will fail if the optimization is accidentally disabled by a regression. My next step is to submit the test for inclusion in Ceph, when the validation completes successfully[3]. Cheers [0] https://linux.die.net/man/1/perf-script [1] https://git.kernel.org/pub/scm/linux/kernel/git/torvalds/linux.git/tree/tool... [2] https://lab.fedeproxy.eu/ceph/ceph/-/blob/864e22a77ccac23454407573c125a17c55... [3] http://pulpito.front.sepia.ceph.com/dachary-2021-04-24_18:20:26-rados:standa... On 05/04/2021 19:38, Joe Mario wrote:
On Mon, Apr 5, 2021 at 10:38 AM Loïc Dachary <loic@dachary.org <mailto:loic@dachary.org>> wrote: [snip]
> The cpu doing that atomic instruction needs to first get ownership of the cacheline. If no other threads of execution are also trying to get ownership of that cacheline, then ownership is granted rather quickly. > If, however, there are many other threads of execution trying to get ownership of that cacheline, then all those cpus must "get in line" and wait their turn. > And if there are N CPUs and N*2 threads, the only way to avoid cacheline contention is if all of these threads use a different (cacheline aligned) variable. Is that correct? If it is correct, I wonder if cacheline contention has a linear impact on performances. If there is cacheline contention on 1 variable with N threads on N CPUS, will the performance degradation be the same if there is cacheline contention on 10 variables and the same number of threads & CPUS? Or will it get worse because there is some sort of amplification?
In your test case, you avoided all cacheline contention by putting every lock into its own cacheline. In practice, however, multiple threads need to be contending for the same locks to modify shared data.
The goal is to look at your application's hottest contended cachelines to see if that contention can be minimized. Some of the ways to do that include: 1) Seeing if the number of accesses to that line can be minimized, especially the writers. 2) Making sure multiple hot data variables don't share the same cacheline. 3) Looking to see if the accesses to the hot cachelines are coming from
the same numa node as where the hot data lives. This isn't always possible, but it's good to examine it.
I'd like for the test script to extract those number from the files
produced by perf c2c. How do you suggest I go about this?
Doing it for this test case was somewhat trivial, albeit fragile.
That's because the "without-sharding" version only had one contended cacheline, and the "with-sharding" version had no contended cacheline.
Because of that, I was able to dump the raw data and add up the load latencies for the test program's load instructions. The steps I used were: # perf script -i perf_c2c_a_all_user.data > t.script -f # grep ceph_test_c2c t.script |grep ldlat |sed -e 's/^.*LCK//' |awk '{s+=$2;c+=1}END {print s " " c " " s/c}'
However the above simple script won't work when there's more than one hot cacheline involved. You can still find the data you want, it just gets more complicated. Plus, the real value in perf c2c is not just seeing the load latencies, but rather to learn everything about the contention which will then help guide how to minimize it. It provides a lot of insight into what's happening.
How does this approach sound? 1) You set up Ceph to run on a bigger multi-node server with fast storage. 2) Run the attached script, which is just an updated version of the script you've been running. 3) Then we can set up a shared video call where I can walk you through the perf c2c output pointing out all the key pieces of information. 4) With the insight from "3" above, you can then decide what you might want to automate and how it might be done.
Does that sound reasonable?
See the attached "run_c2c_ceph2.sh" script. Joe
-- Loïc Dachary, Artisan Logiciel Libre
Hi Loïc On Sat, Apr 24, 2021 at 2:22 PM Loïc Dachary <loic@dachary.org> wrote:
Hi Joe,
I looked into perf script[0], trying to extract information related to the c2c test, in an attempt to make your " grep ceph_test_c2c t.script |grep ldlat |sed -e 's/^.*LCK//' |awk '{s+=$2;c+=1}END {print s " " c " " s/c}'" line more flexible. The first problem I had was to figure out which fields are displayed by default: the --fields does not say and there does not seem to be a way to show the field labels. I took a look at the sources[1] and while the beginning (command name, pid/tid, cpu) can be guessed easily, it becomes blurry towards the end of a line like:
ceph_test_c2c 184970 [000] 617917.424796: 37057 cpu/mem-stores/P: 7ffcf821fef4 5080144 L1 hit|SNP N/A|TLB N/A|LCK N/A 0 55629c5f8708 [unknown] (/home/loic/ceph/build/bin/ceph_test_c2c) 5b4f81ef4
It looked like I could loose myself into this and did not investigate further.
It is very easy to get lost. When I shared that "perf script" output with you, I never expected that you'd be using it. The output of "perf script" is pretty cryptic and not well documented. When I used the "perf script" command, it only worked because of your very unique test case, which had only one cacheline being contended. I have never used it before because no other program I ever looked at only had one cacheline with contention. Can that "perf script" technique be used in a larger program with more contended cachelines? Perhaps, but it wouldn't be my preferred approach. I did not followup on your suggestion to run perf on a running Ceph cluster
either (sorry to disapoint :-( ) because I'd like to complete this simple task first. Trying to undertake anything more ambitious would be difficult.
However! As you suggested I modified the test[2] with your new shell script and ran it on a real server (128 cores, 700+GB RAM). You will find the result in dropbox.redhat.com under the name ceph-c2c-jmario-2021-04-24-20-13.tar.gz. Hopefully they are consistent: I can't judge for myself because the content of the perf report is still quite mysterious. The metric I set is satisfied (optimization is at least twice faster) and it is good enough to propose this for integration in the Ceph test suite. The test will fail if the optimization is accidentally disabled by a regression.
But when I look at your data, I still only see the small test case. I assumed you would be running the c2c script on a large fast server where Ceph was under a heavy real workload. Is that something you can do? The risk of the small test case is that it may not represent the contention situations in the larger Ceph codebase. How about if we try this approach: 1) You run my c2c script on a large fast server running Ceph in a heavy workoad. I expect to see many cachelines being contended. 2) I analyze the results, and send back my findings. 3) We then have an interactive meeting where I can walk you through what I found and how I found it. 4) Then from step 4, you'll be able to better understand how you can create a test or tests that you can integrate into the Ceph test suite. Does the above make sense? Joe
participants (7)
-
Adam Kupczyk
-
jmario@redhat.com
-
Joe Mario
-
kefu chai
-
Loïc Dachary
-
Mark Nelson
-
Nathan Cutler