
1 Jun
2020
1 Jun
'20
11:50 a.m.
Hi All,
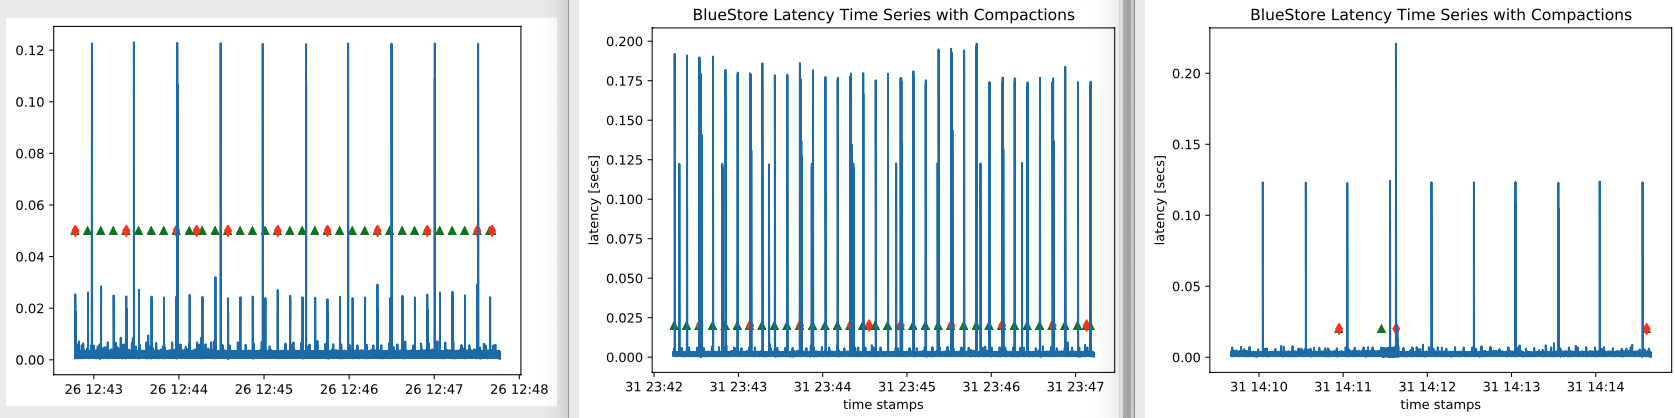
I have noticed that different RBD image size can shape the bluestore latency differently.
Is there baseline or guidance for choosing the image size?
Left: RBD image size is 1GB
middle: RBD image size is 40GB
Right: RBD image size is 1GB, RocksDB write buffer 10X default
4K randwrite on SSD with FIO. SSD is preconditioned and image is prefilled(20mins).
Red dot is L1 compaction and green dot is L0 compaction.
Let’s focus on the left graph. The smaller spikes are caused by compactions. The higher
spikes seems to be caused by the BlueStore itself.
I suspect this could be related to RBD image size in someway.
Does anyone know what could the cause of the higher spikes? And how to debug it?
Also, what is the proper RBD image size for my test?
Please advice.
Thanks,
Yiming

1 Jun
1 Jun
5:10 p.m.
Hi Yiming,
Are you changing the overall data set size when you change the image
size? IE in your 40GB image test, is your data set 40x larger than in
your 1GB image test? That would have various effects, including
changing the number of onodes in the cache and the potential for cache
misses hitting rocksdb and eventually the disk. Having said that, with
the default 4GB memory target I wouldn't expect you to have cache misses
with typical RBD workloads even with a 40GB dataset on a single OSD
unless you've tweaked the object size to be smaller or caused additional
metadata per object in some way (EC, etc).
Theoretically you might be able to use lttng or jaeger tracepoints to
track latency, or possible look at the perf counters. Otherwise you
might also be able to see something through wallclock profiling. I
would probably look carefully at things happening in the kv sync thread
since this is a random write workload and that's where I'd expect to see
blocking behavior that could cause latency spikes like this.
Mark
On 6/1/20 1:50 PM, Yiming Zhang wrote:
Hi All,
I have noticed that different RBD image size can shape the bluestore
latency differently. Is there baseline or guidance for choosing the
image size?
Left: RBD image size is 1GB
middle: RBD image size is 40GB
Right: RBD image size is 1GB, RocksDB write buffer 10X default
4K randwrite on SSD with FIO. SSD is preconditioned and image is
prefilled(20mins).
Red dot is L1 compaction and green dot is L0 compaction.
Let’s focus on the left graph. The smaller spikes are caused by
compactions. The higher spikes seems to be caused by the BlueStore
itself.
I suspect this could be related to RBD image size in someway.
Does anyone know what could the cause of the higher spikes? And how to
debug it?
Also, what is the proper RBD image size for my test?
Please advice.
Thanks,
Yiming
_______________________________________________
Dev mailing list -- dev(a)ceph.io
To unsubscribe send an email to dev-leave(a)ceph.io
9:58 p.m.
On Jun 1, 2020, at 5:10 PM, Mark Nelson
<mnelson(a)redhat.com> wrote:
Hi Yiming,
Are you changing the overall data set size when you change the image size? IE in your
40GB image test, is your data set 40x larger than in your 1GB image test?
I’m
using the same workload:
rw=randwrite
bs=4096
time_based=1
runtime=300
direct = 1
iodepth=48
Both run has the same run time 300s.
That would have various effects, including changing
the number of onodes in the cache and the potential for cache misses hitting rocksdb and
eventually the disk. Having said that, with the default 4GB memory target I wouldn't
expect you to have cache misses with typical RBD workloads even with a 40GB dataset on a
single OSD unless you've tweaked the object size to be smaller or caused additional
metadata per object in some way (EC, etc).
Theoretically you might be able to use lttng or jaeger tracepoints to track latency, or
possible look at the perf counters. Otherwise you might also be able to see something
through wallclock profiling.
I tried the gdb wallclock profiling. The I can only see
the fio and osd related time, not include the bluestore resources. Details please see here
<https://pastebin.com/6UiLRGvY>.
I added bunch of perf counters in BlueStore to track the latencies. I don’t see any
suspicious counters. For locking behavior, is there any possible reasons for that? Really
appreciated if you could point me which lock you mean in kv_sync_thread.
Thanks,
Yiming
I would probably look carefully at things happening
in the kv sync thread since this is a random write workload and that's where I'd
expect to see blocking behavior that could cause latency spikes like this.
Mark
On 6/1/20 1:50 PM, Yiming Zhang wrote:
Hi All,
I have noticed that different RBD image size can shape the bluestore latency differently.
Is there baseline or guidance for choosing the image size?
Left: RBD image size is 1GB
middle: RBD image size is 40GB
Right: RBD image size is 1GB, RocksDB write buffer 10X default
4K randwrite on SSD with FIO. SSD is preconditioned and image is prefilled(20mins).
Red dot is L1 compaction and green dot is L0 compaction.
Let’s focus on the left graph. The smaller spikes are caused by compactions. The higher
spikes seems to be caused by the BlueStore itself.
I suspect this could be related to RBD image size in someway.
Does anyone know what could the cause of the higher spikes? And how to debug it?
Also, what is the proper RBD image size for my test?
Please advice.
Thanks,
Yiming
_______________________________________________
Dev mailing list -- dev(a)ceph.io
To unsubscribe send an email to dev-leave(a)ceph.io
_______________________________________________
Dev mailing list -- dev(a)ceph.io
To unsubscribe send an email to dev-leave(a)ceph.io
2 Jun
2 Jun
3:57 a.m.
On 6/1/20 11:58 PM, Yiming Zhang wrote:
Ok, but are you doing the randwrite workload across the entire image in
both cases? If so, that will be many more objects you are spanning
writes across for the 40GB image vs the 1GB image.
It looks to me like you ran it against the client fio process rather
than the OSD?
On Jun 1, 2020, at 5:10 PM, Mark Nelson
<mnelson(a)redhat.com
<mailto:mnelson@redhat.com>> wrote:
Hi Yiming,
Are you changing the overall data set size when you change the image
size? IE in your 40GB image test, is your data set 40x larger than
in your 1GB image test?
I’m using the same workload:
rw=randwrite
bs=4096
time_based=1
runtime=300
direct = 1
iodepth=48
Both run has the same run time 300s. That would have various effects,
including changing the number of
onodes in the cache and the potential for cache misses hitting
rocksdb and eventually the disk. Having said that, with the default
4GB memory target I wouldn't expect you to have cache misses with
typical RBD workloads even with a 40GB dataset on a single OSD unless
you've tweaked the object size to be smaller or caused additional
metadata per object in some way (EC, etc).
Theoretically you might be able to use lttng or jaeger tracepoints to
track latency, or possible look at the perf counters. Otherwise you
might also be able to see something through wallclock profiling.
I tried the gdb
wallclock profiling. The I can only see the fio and
osd related time, not include the bluestore resources. Details please
see here <https://pastebin.com/6UiLRGvY>.
I added bunch of perf counters in BlueStore to track the latencies. I
don’t see any suspicious counters. For locking behavior, is there any
possible reasons for that? Really appreciated if you could point me
which lock you mean in kv_sync_thread.
Thanks,
Yiming
I would probably look carefully at things
happening in the kv sync
thread since this is a random write workload and that's where I'd
expect to see blocking behavior that could cause latency spikes like
this.
Mark
On 6/1/20 1:50 PM, Yiming Zhang wrote:
Hi All,
I have noticed that different RBD image size can shape the bluestore
latency differently. Is there baseline or guidance for choosing the
image size?
Left: RBD image size is 1GB
middle: RBD image size is 40GB
Right: RBD image size is 1GB, RocksDB write buffer 10X default
4K randwrite on SSD with FIO. SSD is preconditioned and image is
prefilled(20mins).
Red dot is L1 compaction and green dot is L0 compaction.
Let’s focus on the left graph. The smaller spikes are caused by
compactions. The higher spikes seems to be caused by the BlueStore
itself.
I suspect this could be related to RBD image size in someway.
Does anyone know what could the cause of the higher spikes? And how
to debug it?
Also, what is the proper RBD image size for my test?
Please advice.
Thanks,
Yiming
_______________________________________________
Dev mailing list -- dev(a)ceph.io <mailto:dev@ceph.io>
To unsubscribe send an email to dev-leave(a)ceph.io
<mailto:dev-leave@ceph.io>
_______________________________________________
Dev mailing list -- dev(a)ceph.io <mailto:dev@ceph.io>
To unsubscribe send an email to dev-leave(a)ceph.io
<mailto:dev-leave@ceph.io>
6:21 a.m.
On Jun 2, 2020, at 3:57 AM, Mark Nelson
<mnelson(a)redhat.com> wrote:
On 6/1/20 11:58 PM, Yiming Zhang wrote:
Ok, but are you doing the randwrite workload across the entire image in both cases? If
so, that will be many more objects you are spanning writes across for the 40GB image vs
the 1GB image.
Yes, I’m doing the workload across the entire the image. Because the object size
is 4MB, 40GB image will have more objects than 1GB image. So in my test, the image size
doesn’t matter, right? Or the right way of doing this is to limit the number of object?
If so, what’s the right way to limit the number of object?
On Jun 1, 2020, at 5:10 PM, Mark Nelson
<mnelson(a)redhat.com <mailto:mnelson@redhat.com>> wrote:
Hi Yiming,
Are you changing the overall data set size when you change the image size? IE in your
40GB image test, is your data set 40x larger than in your 1GB image test?
I’m
using the same workload:
rw=randwrite
bs=4096
time_based=1
runtime=300
direct = 1
iodepth=48
Both run has the same run time 300s. That would have various effects, including
changing the number of onodes in the cache and the potential for cache misses hitting
rocksdb and eventually the disk. Having said that, with the default 4GB memory target I
wouldn't expect you to have cache misses with typical RBD workloads even with a 40GB
dataset on a single OSD unless you've tweaked the object size to be smaller or caused
additional metadata per object in some way (EC, etc).
Theoretically you might be able to use lttng or jaeger tracepoints to track latency, or
possible look at the perf counters. Otherwise you might also be able to see something
through wallclock profiling.
I tried the gdb wallclock profiling. The I can only
see the fio and osd related time, not include the bluestore resources. Details please see
here <https://pastebin.com/6UiLRGvY>.
I added bunch of perf counters in BlueStore to track the latencies. I don’t see any
suspicious counters. For locking behavior, is there any possible reasons for that? Really
appreciated if you could point me which lock you mean in kv_sync_thread.
Thanks,
Yiming
I would probably look carefully at things
happening in the kv sync thread since this is a random write workload and that's where
I'd expect to see blocking behavior that could cause latency spikes like this.
Mark
On 6/1/20 1:50 PM, Yiming Zhang wrote:
Hi All,
I have noticed that different RBD image size can shape the bluestore latency differently.
Is there baseline or guidance for choosing the image size?
Left: RBD image size is 1GB
middle: RBD image size is 40GB
Right: RBD image size is 1GB, RocksDB write buffer 10X default
4K randwrite on SSD with FIO. SSD is preconditioned and image is prefilled(20mins).
Red dot is L1 compaction and green dot is L0 compaction.
Let’s focus on the left graph. The smaller spikes are caused by compactions. The higher
spikes seems to be caused by the BlueStore itself.
I suspect this could be related to RBD image size in someway.
Does anyone know what could the cause of the higher spikes? And how to debug it?
Also, what is the proper RBD image size for my test?
Please advice.
Thanks,
Yiming
_______________________________________________
Dev mailing list -- dev(a)ceph.io <mailto:dev@ceph.io>
To unsubscribe send an email to dev-leave(a)ceph.io <mailto:dev-leave@ceph.io>
_______________________________________________
Dev mailing list -- dev(a)ceph.io <mailto:dev@ceph.io>
To unsubscribe send an email to dev-leave(a)ceph.io <mailto:dev-leave@ceph.io>
7:22 a.m.
On 6/2/20 8:21 AM, Yiming Zhang wrote:
You could try writing to file(s) on the image rather than across the
entire image itself (assuming you are using a posix engine rather than
librbd directly). Otherwise I think you might be able to restrict the
range that fio will write to via other paramters, but I don't remember
how to do it off the top of my head.
It looks to me like you ran it against the client fio process rather than the OSD?
Yes, I’m using it against client fio process. When I use the ps command, I can see the
fio, mon, osd process. I’ll try the osd process.
Thanks,
Yiming
>> Thanks,
>> Yiming
>>> I would probably look carefully at things happening in the kv sync thread
since this is a random write workload and that's where I'd expect to see blocking
behavior that could cause latency spikes like this.
>>>
>>>
>>> Mark
>>>
>>> On 6/1/20 1:50 PM, Yiming Zhang wrote:
>>>> Hi All,
>>>>
>>>> I have noticed that different RBD image size can shape the bluestore
latency differently. Is there baseline or guidance for choosing the image size?
>>>> Left: RBD image size is 1GB
>>>> middle: RBD image size is 40GB
>>>> Right: RBD image size is 1GB, RocksDB write buffer 10X default
>>>>
>>>> 4K randwrite on SSD with FIO. SSD is preconditioned and image is
prefilled(20mins).
>>>> Red dot is L1 compaction and green dot is L0 compaction.
>>>>
>>>>
>>>> Let’s focus on the left graph. The smaller spikes are caused by
compactions. The higher spikes seems to be caused by the BlueStore itself.
>>>> I suspect this could be related to RBD image size in someway.
>>>>
>>>> Does anyone know what could the cause of the higher spikes? And how to
debug it?
>>>>
>>>> Also, what is the proper RBD image size for my test?
>>>>
>>>> Please advice.
>>>>
>>>> Thanks,
>>>> Yiming
>>>>
>>>> _______________________________________________
>>>> Dev mailing list -- dev(a)ceph.io <mailto:dev@ceph.io>
>>>> To unsubscribe send an email to dev-leave(a)ceph.io
<mailto:dev-leave@ceph.io>
>>> _______________________________________________
>>> Dev mailing list -- dev(a)ceph.io <mailto:dev@ceph.io>
>>> To unsubscribe send an email to dev-leave(a)ceph.io
<mailto:dev-leave@ceph.io>
On Jun 2, 2020, at 3:57 AM, Mark Nelson
<mnelson(a)redhat.com> wrote:
On 6/1/20 11:58 PM, Yiming Zhang wrote:
Ok, but are you doing the randwrite workload across the entire image in both cases? If
so, that will be many more objects you are spanning writes across for the 40GB image vs
the 1GB image.
Yes, I’m doing the workload across the entire the image. Because the object size
is 4MB, 40GB image will have more objects than 1GB image. So in my test, the image size
doesn’t matter, right? Or the right way of doing this is to limit the number of object?
If so, what’s the right way to limit the number of object? On Jun 1, 2020, at 5:10 PM, Mark Nelson
<mnelson(a)redhat.com <mailto:mnelson@redhat.com>> wrote:
Hi Yiming,
Are you changing the overall data set size when you change the image size? IE in your
40GB image test, is your data set 40x larger than in your 1GB image test?
I’m using
the same workload:
rw=randwrite
bs=4096
time_based=1
runtime=300
direct = 1
iodepth=48
Both run has the same run time 300s. That would
have various effects, including changing the number of onodes in the cache and the
potential for cache misses hitting rocksdb and eventually the disk. Having said that,
with the default 4GB memory target I wouldn't expect you to have cache misses with
typical RBD workloads even with a 40GB dataset on a single OSD unless you've tweaked
the object size to be smaller or caused additional metadata per object in some way (EC,
etc).
Theoretically you might be able to use lttng or jaeger tracepoints to track latency, or
possible look at the perf counters. Otherwise you might also be able to see something
through wallclock profiling.
I tried the gdb wallclock profiling. The I can only
see the fio and osd related time, not include the bluestore resources. Details please see
here <https://pastebin.com/6UiLRGvY>.
I added bunch of perf counters in BlueStore to track the latencies. I don’t see any
suspicious counters. For locking behavior, is there any possible reasons for that? Really
appreciated if you could point me which lock you mean in kv_sync_thread.
1424
days inactive
1425
days old
5 comments
2 participants
participants (2)
-
 Mark Nelson
 -
 Yiming Zhang