Determine client/inode/dnode source of massive explosion in CephFS metadata pool usage (Red Hat Nautilus CephFS)
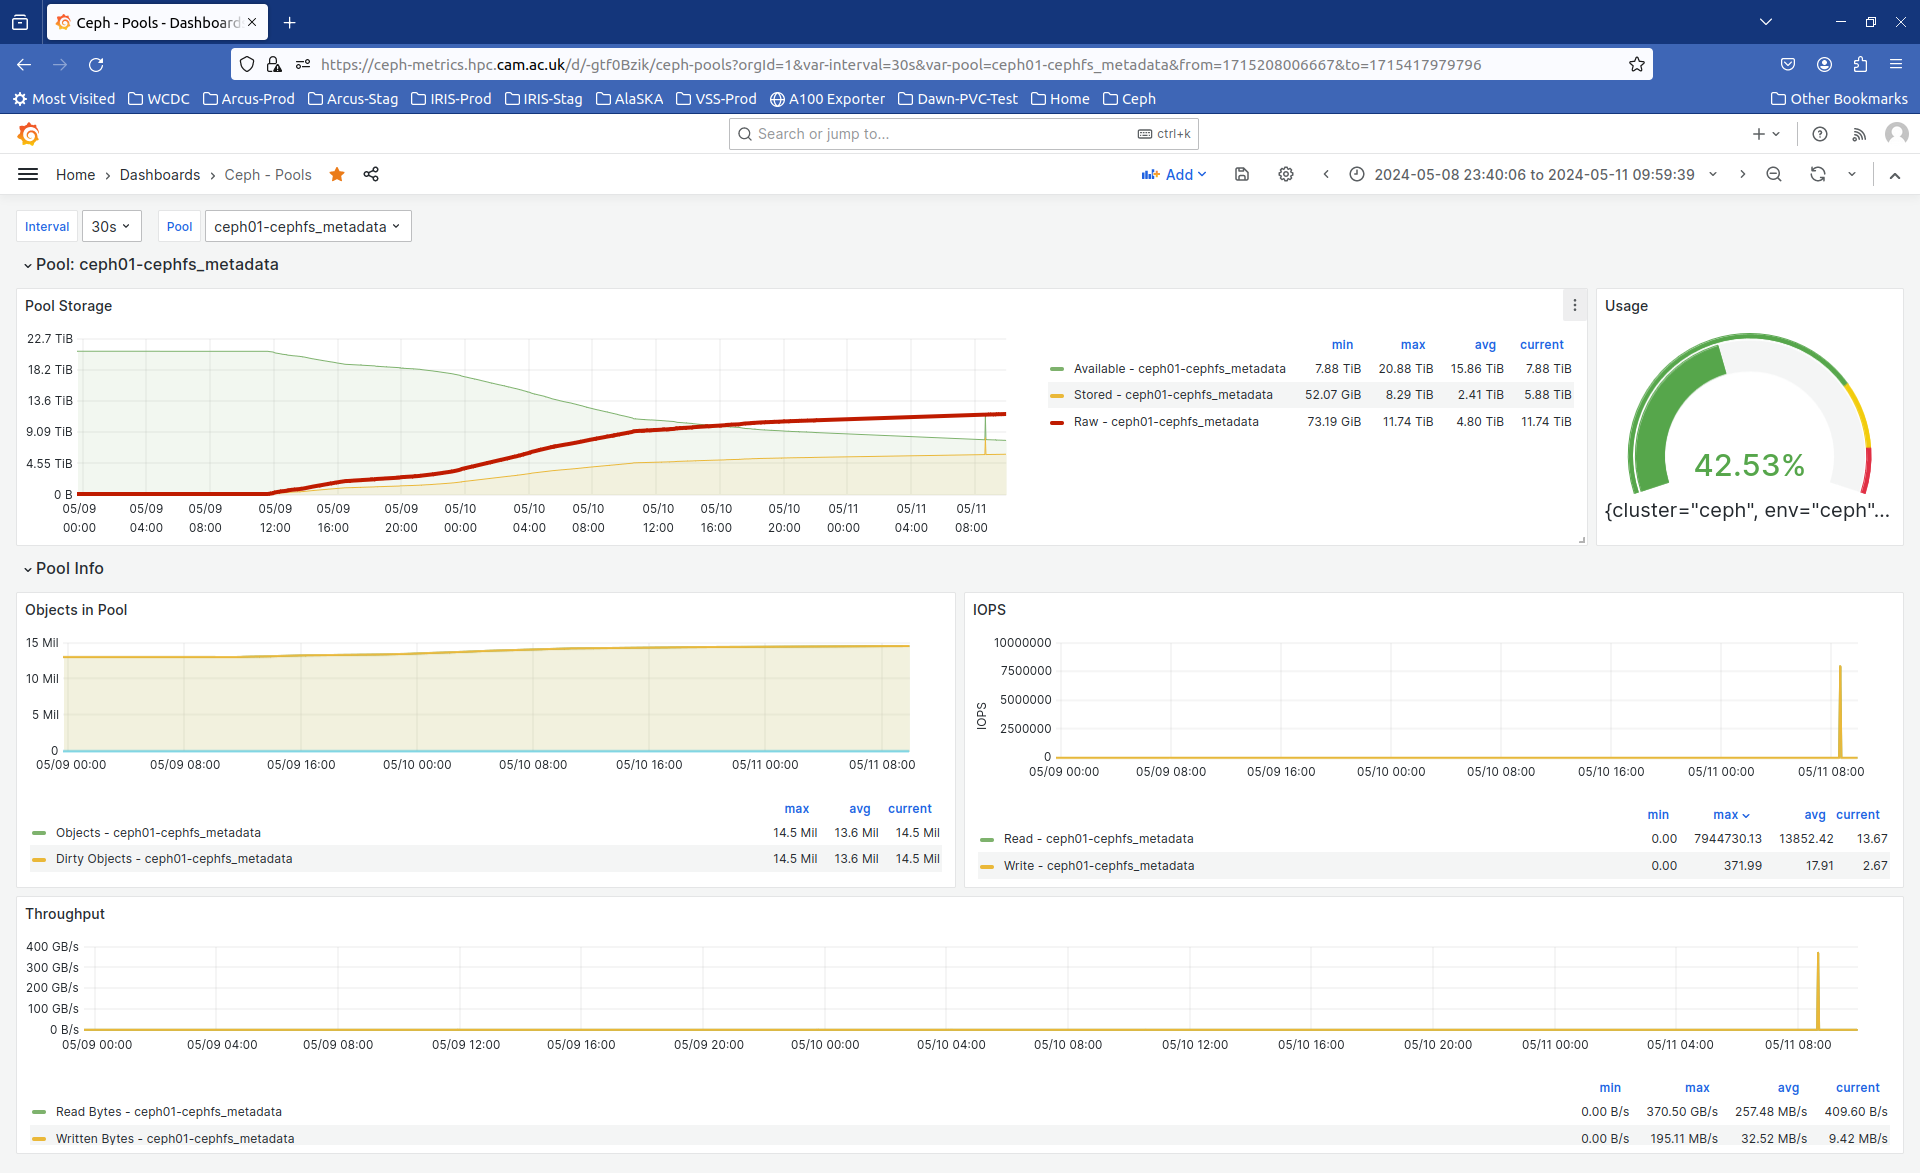
Hello Ceph users, We've recently seen a very massive uptick in the stored capacity of our CephFS metadata pool, 150X the raw stored capacity used in a very short timeframe of only 48 hours or so. The number of stored objects rose by ~1.5 million or so in that timeframe (attached PNG shows the increase) What I'd really like to be able to determine, but haven't yet figured out how, is to map these newly stored objects (over this limited time window) to inodes/dnodes in the filesystem and from there to individual namespaces being used in the filesystem. This should then allow me to track back the increased usage to specific projects using the filesystem for research data storage and give them a mild warning about possibly exhausting the available metadata pool capacity. Would anyone know if there's any capability in CephFs to do something like this, specifically in Nautilus (being run here as Red Hat Ceph Storage 4)? We've scheduled upgrades to later RHCS releases, but I'd like the cluster and CephFS state to be in a better place first if possible. Thanks, Paul Browne [cid:e87ad248-6621-4e9d-948b-da4428f8dbb8] ******************* Paul Browne Research Computing Platforms University Information Services Roger Needham Building JJ Thompson Avenue University of Cambridge Cambridge United Kingdom E-Mail: pfb29@cam.ac.uk<mailto:pfb29@cam.ac.uk> Tel: 0044-1223-746548 *******************
Is your cluster status OK? I have encountered the problem of rapid expansion of the mds data pool because the mds log was not pruned in time. After the cluster status returns to health, the mds pool returns to its original size. Paul Browne <pfb29@cam.ac.uk> 于2024年5月11日周六 17:15写道:
Hello Ceph users,
We've recently seen a very massive uptick in the stored capacity of our CephFS metadata pool, 150X the raw stored capacity used in a very short timeframe of only 48 hours or so. The number of stored objects rose by ~1.5 million or so in that timeframe (attached PNG shows the increase)
What I'd really like to be able to determine, but haven't yet figured out how, is to map these newly stored objects (over this limited time window) to inodes/dnodes in the filesystem and from there to individual namespaces being used in the filesystem.
This should then allow me to track back the increased usage to specific projects using the filesystem for research data storage and give them a mild warning about possibly exhausting the available metadata pool capacity.
Would anyone know if there's any capability in CephFs to do something like this, specifically in Nautilus (being run here as Red Hat Ceph Storage 4)?
We've scheduled upgrades to later RHCS releases, but I'd like the cluster and CephFS state to be in a better place first if possible.
Thanks, Paul Browne
******************* Paul Browne Research Computing Platforms University Information Services Roger Needham Building JJ Thompson Avenue University of Cambridge Cambridge United Kingdom E-Mail: pfb29@cam.ac.uk Tel: 0044-1223-746548 ******************* _______________________________________________ ceph-users mailing list -- ceph-users@ceph.io To unsubscribe send an email to ceph-users-leave@ceph.io
Hi Paul, I don't really have a good answer to your question, but maybe this approach can help track down the clients. Each MDS client has an average "uptime" metric stored in the MDS: storage01:~ # ceph tell mds.cephfs.storage04.uxkclk session ls ... "id": 409348719, ... "uptime": 844831.115640342, ... "entity_id": "nova-mount", "hostname": "FQDN", "kernel_version": "5.4.0-125-generic", "root": "/openstack-cluster/nova-instances" ... This client has the shortest uptime (9 days), it was a compute node which was integrated into openstack 9 days ago. I don't know your CephFS directory structure, could this help identify the client in your case? Regards, Eugen Zitat von Paul Browne <pfb29@cam.ac.uk>:
Hello Ceph users,
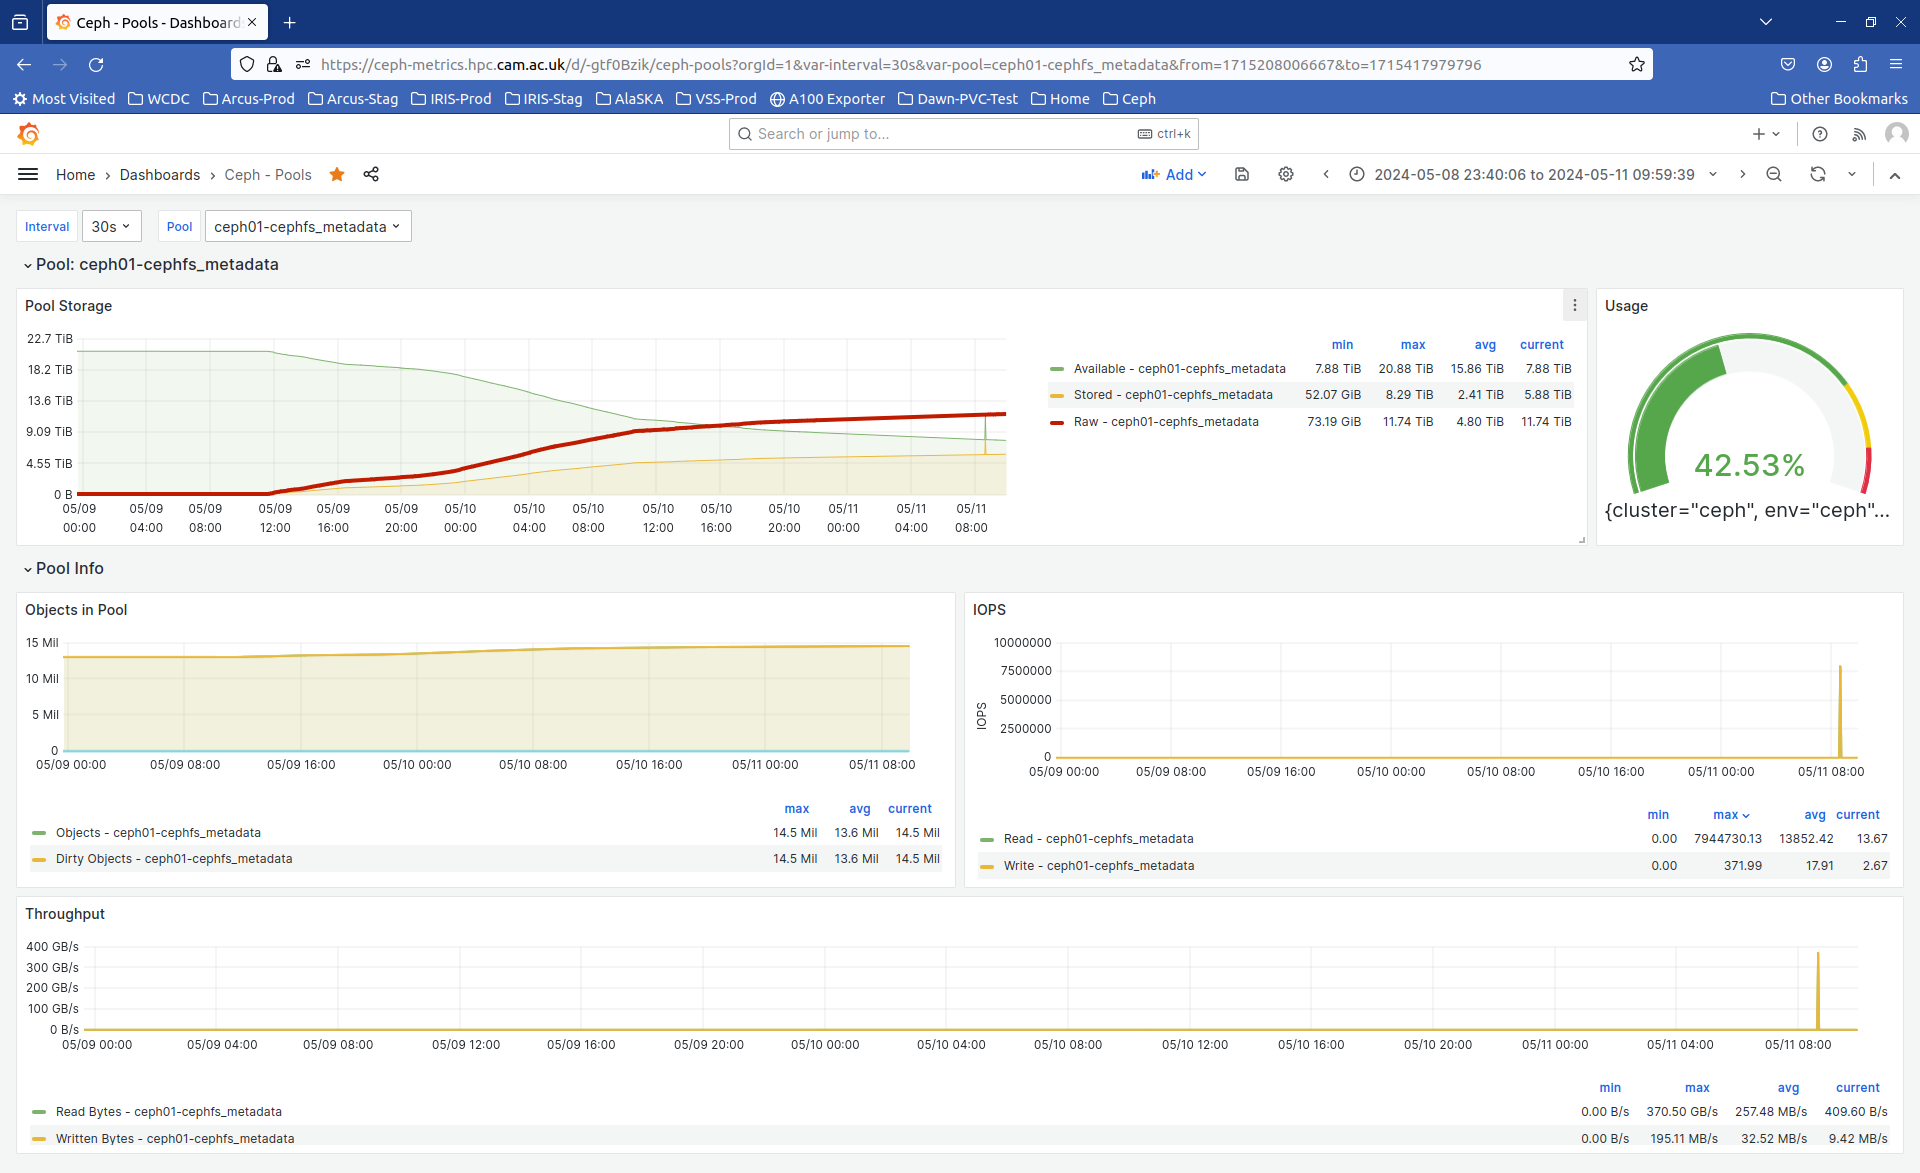
We've recently seen a very massive uptick in the stored capacity of our CephFS metadata pool, 150X the raw stored capacity used in a very short timeframe of only 48 hours or so. The number of stored objects rose by ~1.5 million or so in that timeframe (attached PNG shows the increase)
What I'd really like to be able to determine, but haven't yet figured out how, is to map these newly stored objects (over this limited time window) to inodes/dnodes in the filesystem and from there to individual namespaces being used in the filesystem.
This should then allow me to track back the increased usage to specific projects using the filesystem for research data storage and give them a mild warning about possibly exhausting the available metadata pool capacity.
Would anyone know if there's any capability in CephFs to do something like this, specifically in Nautilus (being run here as Red Hat Ceph Storage 4)?
We've scheduled upgrades to later RHCS releases, but I'd like the cluster and CephFS state to be in a better place first if possible.
Thanks, Paul Browne
[cid:e87ad248-6621-4e9d-948b-da4428f8dbb8]
******************* Paul Browne Research Computing Platforms University Information Services Roger Needham Building JJ Thompson Avenue University of Cambridge Cambridge United Kingdom E-Mail: pfb29@cam.ac.uk<mailto:pfb29@cam.ac.uk> Tel: 0044-1223-746548 *******************
I just read your message again, you only mention newly created files, not new clients. So my suggestion probably won't help you in this case, but it might help others. :-) Zitat von Eugen Block <eblock@nde.ag>:
Hi Paul,
I don't really have a good answer to your question, but maybe this approach can help track down the clients.
Each MDS client has an average "uptime" metric stored in the MDS:
storage01:~ # ceph tell mds.cephfs.storage04.uxkclk session ls ... "id": 409348719, ... "uptime": 844831.115640342, ... "entity_id": "nova-mount", "hostname": "FQDN", "kernel_version": "5.4.0-125-generic", "root": "/openstack-cluster/nova-instances" ...
This client has the shortest uptime (9 days), it was a compute node which was integrated into openstack 9 days ago. I don't know your CephFS directory structure, could this help identify the client in your case?
Regards, Eugen
Zitat von Paul Browne <pfb29@cam.ac.uk>:
Hello Ceph users,
We've recently seen a very massive uptick in the stored capacity of our CephFS metadata pool, 150X the raw stored capacity used in a very short timeframe of only 48 hours or so. The number of stored objects rose by ~1.5 million or so in that timeframe (attached PNG shows the increase)
What I'd really like to be able to determine, but haven't yet figured out how, is to map these newly stored objects (over this limited time window) to inodes/dnodes in the filesystem and from there to individual namespaces being used in the filesystem.
This should then allow me to track back the increased usage to specific projects using the filesystem for research data storage and give them a mild warning about possibly exhausting the available metadata pool capacity.
Would anyone know if there's any capability in CephFs to do something like this, specifically in Nautilus (being run here as Red Hat Ceph Storage 4)?
We've scheduled upgrades to later RHCS releases, but I'd like the cluster and CephFS state to be in a better place first if possible.
Thanks, Paul Browne
[cid:e87ad248-6621-4e9d-948b-da4428f8dbb8]
******************* Paul Browne Research Computing Platforms University Information Services Roger Needham Building JJ Thompson Avenue University of Cambridge Cambridge United Kingdom E-Mail: pfb29@cam.ac.uk<mailto:pfb29@cam.ac.uk> Tel: 0044-1223-746548 *******************
I think you can do the following. NOTE: If you know the objects that are recently created, you can skip to step 5 1. List the objects in the metadata pool and copy it to a file rados -p <metadatapool> ls > /tmp/metadata_obj_list 2. Prepare a bulk stat script for each object. Unfortunately xargs didn't work with rados cmd. sed "s/^/rados -p <metadatapool> stat /g" /tmp/metadata_obj_list -i 3. bash /tmp/metadata_obj_list 4. Find out the recently created objects based on stat output from step 3 5. Pick any recently created object to map to the directory path rados -p <metadatapool> getxattr <obj-name> parent | ceph-dencoder type 'inode_backtrace_t' import - decode dump_json e.g., $rados -p cephfs.a.meta getxattr 100000001f9.00000000 parent | ceph-dencoder type 'inode_backtrace_t' import - decode dump_json { "ino": 1099511628281, "ancestors": [ { "dirino": 1099511628280, "dname": "dir3", "version": 4 }, { "dirino": 1099511627776, "dname": "dir2", "version": 13 }, { "dirino": 1, "dname": "dir1", "version": 21 } ], "pool": 2, "old_pools": [] } This is directory object of the path /dir1/dir2/dir3 Thanks and Regards, Kotresh H R On Mon, May 13, 2024 at 1:18 PM Eugen Block <eblock@nde.ag> wrote:
I just read your message again, you only mention newly created files, not new clients. So my suggestion probably won't help you in this case, but it might help others. :-)
Zitat von Eugen Block <eblock@nde.ag>:
Hi Paul,
I don't really have a good answer to your question, but maybe this approach can help track down the clients.
Each MDS client has an average "uptime" metric stored in the MDS:
storage01:~ # ceph tell mds.cephfs.storage04.uxkclk session ls ... "id": 409348719, ... "uptime": 844831.115640342, ... "entity_id": "nova-mount", "hostname": "FQDN", "kernel_version": "5.4.0-125-generic", "root": "/openstack-cluster/nova-instances" ...
This client has the shortest uptime (9 days), it was a compute node which was integrated into openstack 9 days ago. I don't know your CephFS directory structure, could this help identify the client in your case?
Regards, Eugen
Zitat von Paul Browne <pfb29@cam.ac.uk>:
Hello Ceph users,
We've recently seen a very massive uptick in the stored capacity of our CephFS metadata pool, 150X the raw stored capacity used in a very short timeframe of only 48 hours or so. The number of stored objects rose by ~1.5 million or so in that timeframe (attached PNG shows the increase)
What I'd really like to be able to determine, but haven't yet figured out how, is to map these newly stored objects (over this limited time window) to inodes/dnodes in the filesystem and from there to individual namespaces being used in the filesystem.
This should then allow me to track back the increased usage to specific projects using the filesystem for research data storage and give them a mild warning about possibly exhausting the available metadata pool capacity.
Would anyone know if there's any capability in CephFs to do something like this, specifically in Nautilus (being run here as Red Hat Ceph Storage 4)?
We've scheduled upgrades to later RHCS releases, but I'd like the cluster and CephFS state to be in a better place first if possible.
Thanks, Paul Browne
[cid:e87ad248-6621-4e9d-948b-da4428f8dbb8]
******************* Paul Browne Research Computing Platforms University Information Services Roger Needham Building JJ Thompson Avenue University of Cambridge Cambridge United Kingdom E-Mail: pfb29@cam.ac.uk<mailto:pfb29@cam.ac.uk> Tel: 0044-1223-746548 *******************
_______________________________________________ ceph-users mailing list -- ceph-users@ceph.io To unsubscribe send an email to ceph-users-leave@ceph.io
participants (4)
-
David Yang
-
Eugen Block
-
Kotresh Hiremath Ravishankar
-
Paul Browne