Modify or override ceph_default_alerts.yml
Hi, All. We are using cephadm to manage a 19.2.0 cluster on fully-updated AlmaLinux 9 hosts, and would greatly appreciate help modifying or overriding the alert rules in ceph_default_alerts.yml. Is the best option to simply update the /var/lib/ceph/<cluster_id>/home/ceph_default_alerts.yml file? In particular, we’d like to either disable the CephPGImbalance alert or change it to calculate averages per-pool or per-crush_rule instead of globally as in [1]. We currently have PG autoscaling enabled, and have two separate crush_rules (one with large spinning disks, one with much smaller nvme drives). Although I don’t believe it causes any technical issues with our configuration, our dashboard is full of CephPGImbalance alerts that would be nice to clean up without having to create periodic silences. Any help or suggestions would be greatly appreciated. Many thanks, Devin [1] https://github.com/rook/rook/discussions/13126#discussioncomment-10043490
Funny, I wanted to take a look next week how to deal with different OSD sizes or if somebody already has a fix for that. My workaround is changing the yaml file for Prometheus as well. Zitat von "Devin A. Bougie" <devin.bougie@cornell.edu>:
Hi, All. We are using cephadm to manage a 19.2.0 cluster on fully-updated AlmaLinux 9 hosts, and would greatly appreciate help modifying or overriding the alert rules in ceph_default_alerts.yml. Is the best option to simply update the /var/lib/ceph/<cluster_id>/home/ceph_default_alerts.yml file?
In particular, we’d like to either disable the CephPGImbalance alert or change it to calculate averages per-pool or per-crush_rule instead of globally as in [1].
We currently have PG autoscaling enabled, and have two separate crush_rules (one with large spinning disks, one with much smaller nvme drives). Although I don’t believe it causes any technical issues with our configuration, our dashboard is full of CephPGImbalance alerts that would be nice to clean up without having to create periodic silences.
Any help or suggestions would be greatly appreciated.
Many thanks, Devin
[1] https://github.com/rook/rook/discussions/13126#discussioncomment-10043490 _______________________________________________ ceph-users mailing list -- ceph-users@ceph.io To unsubscribe send an email to ceph-users-leave@ceph.io
Thanks, Eugen. I’m afraid I haven’t yet found a way to either disable the CephPGImbalance alert or change it to handle different OSD sizes. Changing /var/lib/ceph/<cluster_id>/home/ceph_default_alerts.yml doesn’t seem to have any effect, and I haven’t even managed to change the behavior from within the running prometheus container. If you have a functioning workaround, can you give a little more detail on exactly what yaml file you’re changing and where? Thanks again, Devin
On Dec 30, 2024, at 12:39 PM, Eugen Block <eblock@nde.ag> wrote:
Funny, I wanted to take a look next week how to deal with different OSD sizes or if somebody already has a fix for that. My workaround is changing the yaml file for Prometheus as well.
Zitat von "Devin A. Bougie" <devin.bougie@cornell.edu>:
Hi, All. We are using cephadm to manage a 19.2.0 cluster on fully-updated AlmaLinux 9 hosts, and would greatly appreciate help modifying or overriding the alert rules in ceph_default_alerts.yml. Is the best option to simply update the /var/lib/ceph/<cluster_id>/home/ceph_default_alerts.yml file?
In particular, we’d like to either disable the CephPGImbalance alert or change it to calculate averages per-pool or per-crush_rule instead of globally as in [1].
We currently have PG autoscaling enabled, and have two separate crush_rules (one with large spinning disks, one with much smaller nvme drives). Although I don’t believe it causes any technical issues with our configuration, our dashboard is full of CephPGImbalance alerts that would be nice to clean up without having to create periodic silences.
Any help or suggestions would be greatly appreciated.
Many thanks, Devin
[1] https://github.com/rook/rook/discussions/13126#discussioncomment-10043490 _______________________________________________ ceph-users mailing list -- ceph-users@ceph.io To unsubscribe send an email to ceph-users-leave@ceph.io
_______________________________________________ ceph-users mailing list -- ceph-users@ceph.io To unsubscribe send an email to ceph-users-leave@ceph.io
Hi, sure thing, here's the diff how I changed it to 50% deviation instead of 30%: ---snip--- diff -u /var/lib/ceph/{FSID}/prometheus.host1/etc/prometheus/alerting/ceph_alerts.yml /var/lib/ceph/{FSID}/prometheus.host1/etc/prometheus/alerting/ceph_alerts.yml.dist --- /var/lib/ceph/{FSID}/prometheus.host1/etc/prometheus/alerting/ceph_alerts.yml 2024-12-17 10:03:23.540179209 +0100 +++ /var/lib/ceph/{FSID}/prometheus.host1/etc/prometheus/alerting/ceph_alerts.yml.dist 2024-12-17 10:03:00.380883413 +0100 @@ -237,13 +237,13 @@ type: "ceph_default" - alert: "CephPGImbalance" annotations: - description: "OSD {{ $labels.ceph_daemon }} on {{ $labels.hostname }} deviates by more than 50% from average PG count." + description: "OSD {{ $labels.ceph_daemon }} on {{ $labels.hostname }} deviates by more than 30% from average PG count." summary: "PGs are not balanced across OSDs" expr: | abs( ((ceph_osd_numpg > 0) - on (job) group_left avg(ceph_osd_numpg > 0) by (job)) / on (job) group_left avg(ceph_osd_numpg > 0) by (job) - ) * on (ceph_daemon) group_left(hostname) ceph_osd_metadata > 0.50 + ) * on (ceph_daemon) group_left(hostname) ceph_osd_metadata > 0.30 ---snip--- Then you restart prometheus ('ceph orch ps --daemon-type prometheus' shows you the exact daemon name): ceph orch daemon restart prometheus.host1 This will only work until you upgrade prometheus, of course. Regards, Eugen Zitat von "Devin A. Bougie" <devin.bougie@cornell.edu>:
Thanks, Eugen. I’m afraid I haven’t yet found a way to either disable the CephPGImbalance alert or change it to handle different OSD sizes. Changing /var/lib/ceph/<cluster_id>/home/ceph_default_alerts.yml doesn’t seem to have any effect, and I haven’t even managed to change the behavior from within the running prometheus container.
If you have a functioning workaround, can you give a little more detail on exactly what yaml file you’re changing and where?
Thanks again, Devin
On Dec 30, 2024, at 12:39 PM, Eugen Block <eblock@nde.ag> wrote:
Funny, I wanted to take a look next week how to deal with different OSD sizes or if somebody already has a fix for that. My workaround is changing the yaml file for Prometheus as well.
Zitat von "Devin A. Bougie" <devin.bougie@cornell.edu>:
Hi, All. We are using cephadm to manage a 19.2.0 cluster on fully-updated AlmaLinux 9 hosts, and would greatly appreciate help modifying or overriding the alert rules in ceph_default_alerts.yml. Is the best option to simply update the /var/lib/ceph/<cluster_id>/home/ceph_default_alerts.yml file?
In particular, we’d like to either disable the CephPGImbalance alert or change it to calculate averages per-pool or per-crush_rule instead of globally as in [1].
We currently have PG autoscaling enabled, and have two separate crush_rules (one with large spinning disks, one with much smaller nvme drives). Although I don’t believe it causes any technical issues with our configuration, our dashboard is full of CephPGImbalance alerts that would be nice to clean up without having to create periodic silences.
Any help or suggestions would be greatly appreciated.
Many thanks, Devin
[1] https://github.com/rook/rook/discussions/13126#discussioncomment-10043490 _______________________________________________ ceph-users mailing list -- ceph-users@ceph.io To unsubscribe send an email to ceph-users-leave@ceph.io
_______________________________________________ ceph-users mailing list -- ceph-users@ceph.io To unsubscribe send an email to ceph-users-leave@ceph.io
_______________________________________________ ceph-users mailing list -- ceph-users@ceph.io To unsubscribe send an email to ceph-users-leave@ceph.io
Thanks, Eugen! Just incase you have any more suggestions, this still isn’t quite working for us. Perhaps one clue is that in the Alerts view of the cephadm dashboard, every alert is listed twice. We see two CephPGImbalance alerts, both set to 30% after redeploying the service. If I then follow your procedure, one of the alerts updates to 50% as configured, but the other stays at 30. Is it normal to see each alert listed twice, or did I somehow make a mess of things when trying to change the default alerts? No problem if it’s not an obvious answer, we can live with and ignore the spurious CephPGImbalance alerts. Thanks again, Devin
On Jan 7, 2025, at 2:14 AM, Eugen Block <eblock@nde.ag> wrote:
Hi,
sure thing, here's the diff how I changed it to 50% deviation instead of 30%:
---snip--- diff -u /var/lib/ceph/{FSID}/prometheus.host1/etc/prometheus/alerting/ceph_alerts.yml /var/lib/ceph/{FSID}/prometheus.host1/etc/prometheus/alerting/ceph_alerts.yml.dist --- /var/lib/ceph/{FSID}/prometheus.host1/etc/prometheus/alerting/ceph_alerts.yml 2024-12-17 10:03:23.540179209 +0100 +++ /var/lib/ceph/{FSID}/prometheus.host1/etc/prometheus/alerting/ceph_alerts.yml.dist 2024-12-17 10:03:00.380883413 +0100 @@ -237,13 +237,13 @@ type: "ceph_default" - alert: "CephPGImbalance" annotations: - description: "OSD {{ $labels.ceph_daemon }} on {{ $labels.hostname }} deviates by more than 50% from average PG count." + description: "OSD {{ $labels.ceph_daemon }} on {{ $labels.hostname }} deviates by more than 30% from average PG count." summary: "PGs are not balanced across OSDs" expr: | abs( ((ceph_osd_numpg > 0) - on (job) group_left avg(ceph_osd_numpg > 0) by (job)) / on (job) group_left avg(ceph_osd_numpg > 0) by (job) - ) * on (ceph_daemon) group_left(hostname) ceph_osd_metadata > 0.50 + ) * on (ceph_daemon) group_left(hostname) ceph_osd_metadata > 0.30 ---snip---
Then you restart prometheus ('ceph orch ps --daemon-type prometheus' shows you the exact daemon name):
ceph orch daemon restart prometheus.host1
This will only work until you upgrade prometheus, of course.
Regards, Eugen
Zitat von "Devin A. Bougie" <devin.bougie@cornell.edu>:
Thanks, Eugen. I’m afraid I haven’t yet found a way to either disable the CephPGImbalance alert or change it to handle different OSD sizes. Changing /var/lib/ceph/<cluster_id>/home/ceph_default_alerts.yml doesn’t seem to have any effect, and I haven’t even managed to change the behavior from within the running prometheus container.
If you have a functioning workaround, can you give a little more detail on exactly what yaml file you’re changing and where?
Thanks again, Devin
On Dec 30, 2024, at 12:39 PM, Eugen Block <eblock@nde.ag> wrote:
Funny, I wanted to take a look next week how to deal with different OSD sizes or if somebody already has a fix for that. My workaround is changing the yaml file for Prometheus as well.
Zitat von "Devin A. Bougie" <devin.bougie@cornell.edu>:
Hi, All. We are using cephadm to manage a 19.2.0 cluster on fully-updated AlmaLinux 9 hosts, and would greatly appreciate help modifying or overriding the alert rules in ceph_default_alerts.yml. Is the best option to simply update the /var/lib/ceph/<cluster_id>/home/ceph_default_alerts.yml file?
In particular, we’d like to either disable the CephPGImbalance alert or change it to calculate averages per-pool or per-crush_rule instead of globally as in [1].
We currently have PG autoscaling enabled, and have two separate crush_rules (one with large spinning disks, one with much smaller nvme drives). Although I don’t believe it causes any technical issues with our configuration, our dashboard is full of CephPGImbalance alerts that would be nice to clean up without having to create periodic silences.
Any help or suggestions would be greatly appreciated.
Many thanks, Devin
[1] https://github.com/rook/rook/discussions/13126#discussioncomment-10043490 _______________________________________________ ceph-users mailing list -- ceph-users@ceph.io To unsubscribe send an email to ceph-users-leave@ceph.io
_______________________________________________ ceph-users mailing list -- ceph-users@ceph.io To unsubscribe send an email to ceph-users-leave@ceph.io
_______________________________________________ ceph-users mailing list -- ceph-users@ceph.io To unsubscribe send an email to ceph-users-leave@ceph.io
_______________________________________________ ceph-users mailing list -- ceph-users@ceph.io To unsubscribe send an email to ceph-users-leave@ceph.io
Do you have two Prometheus instances? Maybe you could share ceph orch ls prometheus --export Or alternatively: ceph orch ps --daemon-type prometheus You can use two instances for HA, but then you need to change the threshold for both, of course. Zitat von "Devin A. Bougie" <devin.bougie@cornell.edu>:
Thanks, Eugen! Just incase you have any more suggestions, this still isn’t quite working for us.
Perhaps one clue is that in the Alerts view of the cephadm dashboard, every alert is listed twice. We see two CephPGImbalance alerts, both set to 30% after redeploying the service. If I then follow your procedure, one of the alerts updates to 50% as configured, but the other stays at 30. Is it normal to see each alert listed twice, or did I somehow make a mess of things when trying to change the default alerts?
No problem if it’s not an obvious answer, we can live with and ignore the spurious CephPGImbalance alerts.
Thanks again, Devin
On Jan 7, 2025, at 2:14 AM, Eugen Block <eblock@nde.ag> wrote:
Hi,
sure thing, here's the diff how I changed it to 50% deviation instead of 30%:
---snip--- diff -u /var/lib/ceph/{FSID}/prometheus.host1/etc/prometheus/alerting/ceph_alerts.yml /var/lib/ceph/{FSID}/prometheus.host1/etc/prometheus/alerting/ceph_alerts.yml.dist --- /var/lib/ceph/{FSID}/prometheus.host1/etc/prometheus/alerting/ceph_alerts.yml 2024-12-17 10:03:23.540179209 +0100 +++ /var/lib/ceph/{FSID}/prometheus.host1/etc/prometheus/alerting/ceph_alerts.yml.dist 2024-12-17 10:03:00.380883413 +0100 @@ -237,13 +237,13 @@ type: "ceph_default" - alert: "CephPGImbalance" annotations: - description: "OSD {{ $labels.ceph_daemon }} on {{ $labels.hostname }} deviates by more than 50% from average PG count." + description: "OSD {{ $labels.ceph_daemon }} on {{ $labels.hostname }} deviates by more than 30% from average PG count." summary: "PGs are not balanced across OSDs" expr: | abs( ((ceph_osd_numpg > 0) - on (job) group_left avg(ceph_osd_numpg > 0) by (job)) / on (job) group_left avg(ceph_osd_numpg > 0) by (job) - ) * on (ceph_daemon) group_left(hostname) ceph_osd_metadata > 0.50 + ) * on (ceph_daemon) group_left(hostname) ceph_osd_metadata > 0.30 ---snip---
Then you restart prometheus ('ceph orch ps --daemon-type prometheus' shows you the exact daemon name):
ceph orch daemon restart prometheus.host1
This will only work until you upgrade prometheus, of course.
Regards, Eugen
Zitat von "Devin A. Bougie" <devin.bougie@cornell.edu>:
Thanks, Eugen. I’m afraid I haven’t yet found a way to either disable the CephPGImbalance alert or change it to handle different OSD sizes. Changing /var/lib/ceph/<cluster_id>/home/ceph_default_alerts.yml doesn’t seem to have any effect, and I haven’t even managed to change the behavior from within the running prometheus container.
If you have a functioning workaround, can you give a little more detail on exactly what yaml file you’re changing and where?
Thanks again, Devin
On Dec 30, 2024, at 12:39 PM, Eugen Block <eblock@nde.ag> wrote:
Funny, I wanted to take a look next week how to deal with different OSD sizes or if somebody already has a fix for that. My workaround is changing the yaml file for Prometheus as well.
Zitat von "Devin A. Bougie" <devin.bougie@cornell.edu>:
Hi, All. We are using cephadm to manage a 19.2.0 cluster on fully-updated AlmaLinux 9 hosts, and would greatly appreciate help modifying or overriding the alert rules in ceph_default_alerts.yml. Is the best option to simply update the /var/lib/ceph/<cluster_id>/home/ceph_default_alerts.yml file?
In particular, we’d like to either disable the CephPGImbalance alert or change it to calculate averages per-pool or per-crush_rule instead of globally as in [1].
We currently have PG autoscaling enabled, and have two separate crush_rules (one with large spinning disks, one with much smaller nvme drives). Although I don’t believe it causes any technical issues with our configuration, our dashboard is full of CephPGImbalance alerts that would be nice to clean up without having to create periodic silences.
Any help or suggestions would be greatly appreciated.
Many thanks, Devin
[1] https://github.com/rook/rook/discussions/13126#discussioncomment-10043490 _______________________________________________ ceph-users mailing list -- ceph-users@ceph.io To unsubscribe send an email to ceph-users-leave@ceph.io
_______________________________________________ ceph-users mailing list -- ceph-users@ceph.io To unsubscribe send an email to ceph-users-leave@ceph.io
_______________________________________________ ceph-users mailing list -- ceph-users@ceph.io To unsubscribe send an email to ceph-users-leave@ceph.io
_______________________________________________ ceph-users mailing list -- ceph-users@ceph.io To unsubscribe send an email to ceph-users-leave@ceph.io
Hi Eugen, No, as far as I can tell I only have one prometheus service running. ——— [root@cephman2 ~]# ceph orch ls prometheus --export service_type: prometheus service_name: prometheus placement: count: 1 label: _admin [root@cephman2 ~]# ceph orch ps --daemon-type prometheus NAME HOST PORTS STATUS REFRESHED AGE MEM USE MEM LIM VERSION IMAGE ID CONTAINER ID prometheus.cephman2 cephman2.classe.cornell.edu *:9095 running (12h) 4m ago 3w 350M - 2.43.0 a07b618ecd1d 5a8d88682c28 ——— Anything else I can check or do? Thanks, Devin On Jan 13, 2025, at 6:39 PM, Eugen Block <eblock@nde.ag> wrote: Do you have two Prometheus instances? Maybe you could share ceph orch ls prometheus --export Or alternatively: ceph orch ps --daemon-type prometheus You can use two instances for HA, but then you need to change the threshold for both, of course. Zitat von "Devin A. Bougie" <devin.bougie@cornell.edu<mailto:devin.bougie@cornell.edu>>: Thanks, Eugen! Just incase you have any more suggestions, this still isn’t quite working for us. Perhaps one clue is that in the Alerts view of the cephadm dashboard, every alert is listed twice. We see two CephPGImbalance alerts, both set to 30% after redeploying the service. If I then follow your procedure, one of the alerts updates to 50% as configured, but the other stays at 30. Is it normal to see each alert listed twice, or did I somehow make a mess of things when trying to change the default alerts? No problem if it’s not an obvious answer, we can live with and ignore the spurious CephPGImbalance alerts. Thanks again, Devin On Jan 7, 2025, at 2:14 AM, Eugen Block <eblock@nde.ag> wrote: Hi, sure thing, here's the diff how I changed it to 50% deviation instead of 30%: ---snip--- diff -u /var/lib/ceph/{FSID}/prometheus.host1/etc/prometheus/alerting/ceph_alerts.yml /var/lib/ceph/{FSID}/prometheus.host1/etc/prometheus/alerting/ceph_alerts.yml.dist --- /var/lib/ceph/{FSID}/prometheus.host1/etc/prometheus/alerting/ceph_alerts.yml 2024-12-17 10:03:23.540179209 +0100 +++ /var/lib/ceph/{FSID}/prometheus.host1/etc/prometheus/alerting/ceph_alerts.yml.dist 2024-12-17 10:03:00.380883413 +0100 @@ -237,13 +237,13 @@ type: "ceph_default" - alert: "CephPGImbalance" annotations: - description: "OSD {{ $labels.ceph_daemon }} on {{ $labels.hostname }} deviates by more than 50% from average PG count." + description: "OSD {{ $labels.ceph_daemon }} on {{ $labels.hostname }} deviates by more than 30% from average PG count." summary: "PGs are not balanced across OSDs" expr: | abs( ((ceph_osd_numpg > 0) - on (job) group_left avg(ceph_osd_numpg > 0) by (job)) / on (job) group_left avg(ceph_osd_numpg > 0) by (job) - ) * on (ceph_daemon) group_left(hostname) ceph_osd_metadata > 0.50 + ) * on (ceph_daemon) group_left(hostname) ceph_osd_metadata > 0.30 ---snip--- Then you restart prometheus ('ceph orch ps --daemon-type prometheus' shows you the exact daemon name): ceph orch daemon restart prometheus.host1 This will only work until you upgrade prometheus, of course. Regards, Eugen Zitat von "Devin A. Bougie" <devin.bougie@cornell.edu>: Thanks, Eugen. I’m afraid I haven’t yet found a way to either disable the CephPGImbalance alert or change it to handle different OSD sizes. Changing /var/lib/ceph/<cluster_id>/home/ceph_default_alerts.yml doesn’t seem to have any effect, and I haven’t even managed to change the behavior from within the running prometheus container. If you have a functioning workaround, can you give a little more detail on exactly what yaml file you’re changing and where? Thanks again, Devin On Dec 30, 2024, at 12:39 PM, Eugen Block <eblock@nde.ag> wrote: Funny, I wanted to take a look next week how to deal with different OSD sizes or if somebody already has a fix for that. My workaround is changing the yaml file for Prometheus as well. Zitat von "Devin A. Bougie" <devin.bougie@cornell.edu>: Hi, All. We are using cephadm to manage a 19.2.0 cluster on fully-updated AlmaLinux 9 hosts, and would greatly appreciate help modifying or overriding the alert rules in ceph_default_alerts.yml. Is the best option to simply update the /var/lib/ceph/<cluster_id>/home/ceph_default_alerts.yml file? In particular, we’d like to either disable the CephPGImbalance alert or change it to calculate averages per-pool or per-crush_rule instead of globally as in [1]. We currently have PG autoscaling enabled, and have two separate crush_rules (one with large spinning disks, one with much smaller nvme drives). Although I don’t believe it causes any technical issues with our configuration, our dashboard is full of CephPGImbalance alerts that would be nice to clean up without having to create periodic silences. Any help or suggestions would be greatly appreciated. Many thanks, Devin [1] https://nam12.safelinks.protection.outlook.com/?url=https%3A%2F%2Fgithub.com%2Frook%2Frook%2Fdiscussions%2F13126%23discussioncomment-10043490&data=05%7C02%7Cdevin.bougie%40cornell.edu%7C27dddfa00b2e4475b30e08dd342b82cc%7C5d7e43661b9b45cf8e79b14b27df46e1%7C0%7C0%7C638724083682129542%7CUnknown%7CTWFpbGZsb3d8eyJFbXB0eU1hcGkiOnRydWUsIlYiOiIwLjAuMDAwMCIsIlAiOiJXaW4zMiIsIkFOIjoiTWFpbCIsIldUIjoyfQ%3D%3D%7C0%7C%7C%7C&sdata=%2FrmKNJ1hVwWdQ5U05CvNXX1Df3f4SR2HAxTyZA3PJKw%3D&reserved=0<https://github.com/rook/rook/discussions/13126#discussioncomment-10043490> _______________________________________________ ceph-users mailing list -- ceph-users@ceph.io<mailto:ceph-users@ceph.io> To unsubscribe send an email to ceph-users-leave@ceph.io<mailto:ceph-users-leave@ceph.io> _______________________________________________ ceph-users mailing list -- ceph-users@ceph.io To unsubscribe send an email to ceph-users-leave@ceph.io _______________________________________________ ceph-users mailing list -- ceph-users@ceph.io To unsubscribe send an email to ceph-users-leave@ceph.io _______________________________________________ ceph-users mailing list -- ceph-users@ceph.io To unsubscribe send an email to ceph-users-leave@ceph.io
Ah, I checked on a newer test cluster (Squid) and now I see what you mean. The alert is shown per OSD in the dashboard, if you open the dropdown you see which daemons are affected. I think it works a bit different in Pacific (that's what the customer is still running) when I last had to modify this. How many OSDs do you have? I noticed that it takes a few seconds for prometheus to clear the warning with only 3 OSDs in my lab cluster. Maybe you could share a screenshot (with redacted sensitive data) showing the alerts? And the status of the affected OSDs as well. Zitat von "Devin A. Bougie" <devin.bougie@cornell.edu>:
Hi Eugen,
No, as far as I can tell I only have one prometheus service running.
———
[root@cephman2 ~]# ceph orch ls prometheus --export
service_type: prometheus
service_name: prometheus
placement:
count: 1
label: _admin
[root@cephman2 ~]# ceph orch ps --daemon-type prometheus
NAME HOST PORTS STATUS REFRESHED AGE MEM USE MEM LIM VERSION IMAGE ID CONTAINER ID
prometheus.cephman2 cephman2.classe.cornell.edu *:9095 running (12h) 4m ago 3w 350M - 2.43.0 a07b618ecd1d 5a8d88682c28
———
Anything else I can check or do?
Thanks, Devin
On Jan 13, 2025, at 6:39 PM, Eugen Block <eblock@nde.ag> wrote:
Do you have two Prometheus instances? Maybe you could share ceph orch ls prometheus --export
Or alternatively: ceph orch ps --daemon-type prometheus
You can use two instances for HA, but then you need to change the threshold for both, of course.
Zitat von "Devin A. Bougie" <devin.bougie@cornell.edu<mailto:devin.bougie@cornell.edu>>:
Thanks, Eugen! Just incase you have any more suggestions, this still isn’t quite working for us.
Perhaps one clue is that in the Alerts view of the cephadm dashboard, every alert is listed twice. We see two CephPGImbalance alerts, both set to 30% after redeploying the service. If I then follow your procedure, one of the alerts updates to 50% as configured, but the other stays at 30. Is it normal to see each alert listed twice, or did I somehow make a mess of things when trying to change the default alerts?
No problem if it’s not an obvious answer, we can live with and ignore the spurious CephPGImbalance alerts.
Thanks again, Devin
On Jan 7, 2025, at 2:14 AM, Eugen Block <eblock@nde.ag> wrote:
Hi,
sure thing, here's the diff how I changed it to 50% deviation instead of 30%:
---snip--- diff -u /var/lib/ceph/{FSID}/prometheus.host1/etc/prometheus/alerting/ceph_alerts.yml /var/lib/ceph/{FSID}/prometheus.host1/etc/prometheus/alerting/ceph_alerts.yml.dist --- /var/lib/ceph/{FSID}/prometheus.host1/etc/prometheus/alerting/ceph_alerts.yml 2024-12-17 10:03:23.540179209 +0100 +++ /var/lib/ceph/{FSID}/prometheus.host1/etc/prometheus/alerting/ceph_alerts.yml.dist 2024-12-17 10:03:00.380883413 +0100 @@ -237,13 +237,13 @@ type: "ceph_default" - alert: "CephPGImbalance" annotations: - description: "OSD {{ $labels.ceph_daemon }} on {{ $labels.hostname }} deviates by more than 50% from average PG count." + description: "OSD {{ $labels.ceph_daemon }} on {{ $labels.hostname }} deviates by more than 30% from average PG count." summary: "PGs are not balanced across OSDs" expr: | abs( ((ceph_osd_numpg > 0) - on (job) group_left avg(ceph_osd_numpg > 0) by (job)) / on (job) group_left avg(ceph_osd_numpg > 0) by (job) - ) * on (ceph_daemon) group_left(hostname) ceph_osd_metadata > 0.50 + ) * on (ceph_daemon) group_left(hostname) ceph_osd_metadata > 0.30 ---snip---
Then you restart prometheus ('ceph orch ps --daemon-type prometheus' shows you the exact daemon name):
ceph orch daemon restart prometheus.host1
This will only work until you upgrade prometheus, of course.
Regards, Eugen
Zitat von "Devin A. Bougie" <devin.bougie@cornell.edu>:
Thanks, Eugen. I’m afraid I haven’t yet found a way to either disable the CephPGImbalance alert or change it to handle different OSD sizes. Changing /var/lib/ceph/<cluster_id>/home/ceph_default_alerts.yml doesn’t seem to have any effect, and I haven’t even managed to change the behavior from within the running prometheus container.
If you have a functioning workaround, can you give a little more detail on exactly what yaml file you’re changing and where?
Thanks again, Devin
On Dec 30, 2024, at 12:39 PM, Eugen Block <eblock@nde.ag> wrote:
Funny, I wanted to take a look next week how to deal with different OSD sizes or if somebody already has a fix for that. My workaround is changing the yaml file for Prometheus as well.
Zitat von "Devin A. Bougie" <devin.bougie@cornell.edu>:
Hi, All. We are using cephadm to manage a 19.2.0 cluster on fully-updated AlmaLinux 9 hosts, and would greatly appreciate help modifying or overriding the alert rules in ceph_default_alerts.yml. Is the best option to simply update the /var/lib/ceph/<cluster_id>/home/ceph_default_alerts.yml file?
In particular, we’d like to either disable the CephPGImbalance alert or change it to calculate averages per-pool or per-crush_rule instead of globally as in [1].
We currently have PG autoscaling enabled, and have two separate crush_rules (one with large spinning disks, one with much smaller nvme drives). Although I don’t believe it causes any technical issues with our configuration, our dashboard is full of CephPGImbalance alerts that would be nice to clean up without having to create periodic silences.
Any help or suggestions would be greatly appreciated.
Many thanks, Devin
[1] https://nam12.safelinks.protection.outlook.com/?url=https%3A%2F%2Fgithub.com%2Frook%2Frook%2Fdiscussions%2F13126%23discussioncomment-10043490&data=05%7C02%7Cdevin.bougie%40cornell.edu%7C27dddfa00b2e4475b30e08dd342b82cc%7C5d7e43661b9b45cf8e79b14b27df46e1%7C0%7C0%7C638724083682129542%7CUnknown%7CTWFpbGZsb3d8eyJFbXB0eU1hcGkiOnRydWUsIlYiOiIwLjAuMDAwMCIsIlAiOiJXaW4zMiIsIkFOIjoiTWFpbCIsIldUIjoyfQ%3D%3D%7C0%7C%7C%7C&sdata=%2FrmKNJ1hVwWdQ5U05CvNXX1Df3f4SR2HAxTyZA3PJKw%3D&reserved=0<https://github.com/rook/rook/discussions/13126#discussioncomment-10043490> _______________________________________________ ceph-users mailing list -- ceph-users@ceph.io<mailto:ceph-users@ceph.io> To unsubscribe send an email to ceph-users-leave@ceph.io<mailto:ceph-users-leave@ceph.io>
_______________________________________________ ceph-users mailing list -- ceph-users@ceph.io To unsubscribe send an email to ceph-users-leave@ceph.io
_______________________________________________ ceph-users mailing list -- ceph-users@ceph.io To unsubscribe send an email to ceph-users-leave@ceph.io
_______________________________________________ ceph-users mailing list -- ceph-users@ceph.io To unsubscribe send an email to ceph-users-leave@ceph.io
Just FYI: cephadm does support providing/using a custom template (see the docs on [1]). For example using the following cmd you can override the prometheus template:
ceph config-key set mgr/cephadm/services/prometheus/prometheus.yml <value>
After changing the template you have to reconfigure the service in order to redeploy the daemons with your new config by:
ceph orch reconfig prometheus
Then you can go to the corresponding directory on /var/lib/ceph/<your-fsid>/<your-daemon>/... to see if the container has got the new config. *Note:* In general most of the templates have some variables and they are used to dynamically generate the configuration files. So be careful when changing the template. I'd recommend using the current one as base (you can see where to find them in the docs) and then modify it to add your custom config but without altering the dynamic parts of the template. [1] https://docs.ceph.com/en/reef/cephadm/services/monitoring/#option-names Best, Redo. On Tue, Jan 14, 2025 at 8:45 AM Eugen Block <eblock@nde.ag> wrote:
Ah, I checked on a newer test cluster (Squid) and now I see what you mean. The alert is shown per OSD in the dashboard, if you open the dropdown you see which daemons are affected. I think it works a bit different in Pacific (that's what the customer is still running) when I last had to modify this. How many OSDs do you have? I noticed that it takes a few seconds for prometheus to clear the warning with only 3 OSDs in my lab cluster. Maybe you could share a screenshot (with redacted sensitive data) showing the alerts? And the status of the affected OSDs as well.
Zitat von "Devin A. Bougie" <devin.bougie@cornell.edu>:
Hi Eugen,
No, as far as I can tell I only have one prometheus service running.
———
[root@cephman2 ~]# ceph orch ls prometheus --export
service_type: prometheus
service_name: prometheus
placement:
count: 1
label: _admin
[root@cephman2 ~]# ceph orch ps --daemon-type prometheus
NAME HOST PORTS STATUS REFRESHED AGE MEM USE MEM LIM VERSION IMAGE ID CONTAINER ID
prometheus.cephman2 cephman2.classe.cornell.edu *:9095 running (12h) 4m ago 3w 350M - 2.43.0 a07b618ecd1d 5a8d88682c28
———
Anything else I can check or do?
Thanks, Devin
On Jan 13, 2025, at 6:39 PM, Eugen Block <eblock@nde.ag> wrote:
Do you have two Prometheus instances? Maybe you could share ceph orch ls prometheus --export
Or alternatively: ceph orch ps --daemon-type prometheus
You can use two instances for HA, but then you need to change the threshold for both, of course.
Zitat von "Devin A. Bougie" <devin.bougie@cornell.edu<mailto:devin.bougie@cornell.edu>>:
Thanks, Eugen! Just incase you have any more suggestions, this still isn’t quite working for us.
Perhaps one clue is that in the Alerts view of the cephadm dashboard, every alert is listed twice. We see two CephPGImbalance alerts, both set to 30% after redeploying the service. If I then follow your procedure, one of the alerts updates to 50% as configured, but the other stays at 30. Is it normal to see each alert listed twice, or did I somehow make a mess of things when trying to change the default alerts?
No problem if it’s not an obvious answer, we can live with and ignore the spurious CephPGImbalance alerts.
Thanks again, Devin
On Jan 7, 2025, at 2:14 AM, Eugen Block <eblock@nde.ag> wrote:
Hi,
sure thing, here's the diff how I changed it to 50% deviation instead of 30%:
---snip--- diff -u
/var/lib/ceph/{FSID}/prometheus.host1/etc/prometheus/alerting/ceph_alerts.yml
/var/lib/ceph/{FSID}/prometheus.host1/etc/prometheus/alerting/ceph_alerts.yml.dist
---
/var/lib/ceph/{FSID}/prometheus.host1/etc/prometheus/alerting/ceph_alerts.yml 2024-12-17 10:03:23.540179209
+0100 +++
/var/lib/ceph/{FSID}/prometheus.host1/etc/prometheus/alerting/ceph_alerts.yml.dist 2024-12-17 10:03:00.380883413
+0100 @@ -237,13 +237,13 @@ type: "ceph_default" - alert: "CephPGImbalance" annotations: - description: "OSD {{ $labels.ceph_daemon }} on {{ $labels.hostname }} deviates by more than 50% from average PG count." + description: "OSD {{ $labels.ceph_daemon }} on {{ $labels.hostname }} deviates by more than 30% from average PG count." summary: "PGs are not balanced across OSDs" expr: | abs( ((ceph_osd_numpg > 0) - on (job) group_left avg(ceph_osd_numpg > 0) by (job)) / on (job) group_left avg(ceph_osd_numpg > 0) by (job) - ) * on (ceph_daemon) group_left(hostname) ceph_osd_metadata > 0.50 + ) * on (ceph_daemon) group_left(hostname) ceph_osd_metadata > 0.30 ---snip---
Then you restart prometheus ('ceph orch ps --daemon-type prometheus' shows you the exact daemon name):
ceph orch daemon restart prometheus.host1
This will only work until you upgrade prometheus, of course.
Regards, Eugen
Zitat von "Devin A. Bougie" <devin.bougie@cornell.edu>:
Thanks, Eugen. I’m afraid I haven’t yet found a way to either disable the CephPGImbalance alert or change it to handle different OSD sizes. Changing /var/lib/ceph/<cluster_id>/home/ceph_default_alerts.yml doesn’t seem to have any effect, and I haven’t even managed to change the behavior from within the running prometheus container.
If you have a functioning workaround, can you give a little more detail on exactly what yaml file you’re changing and where?
Thanks again, Devin
On Dec 30, 2024, at 12:39 PM, Eugen Block <eblock@nde.ag> wrote:
Funny, I wanted to take a look next week how to deal with different OSD sizes or if somebody already has a fix for that. My workaround is changing the yaml file for Prometheus as well.
Zitat von "Devin A. Bougie" <devin.bougie@cornell.edu>:
Hi, All. We are using cephadm to manage a 19.2.0 cluster on fully-updated AlmaLinux 9 hosts, and would greatly appreciate help modifying or overriding the alert rules in ceph_default_alerts.yml. Is the best option to simply update the /var/lib/ceph/<cluster_id>/home/ceph_default_alerts.yml file?
In particular, we’d like to either disable the CephPGImbalance alert or change it to calculate averages per-pool or per-crush_rule instead of globally as in [1].
We currently have PG autoscaling enabled, and have two separate crush_rules (one with large spinning disks, one with much smaller nvme drives). Although I don’t believe it causes any technical issues with our configuration, our dashboard is full of CephPGImbalance alerts that would be nice to clean up without having to create periodic silences.
Any help or suggestions would be greatly appreciated.
Many thanks, Devin
[1]
https://nam12.safelinks.protection.outlook.com/?url=https%3A%2F%2Fgithub.com%2Frook%2Frook%2Fdiscussions%2F13126%23discussioncomment-10043490&data=05%7C02%7Cdevin.bougie%40cornell.edu%7C27dddfa00b2e4475b30e08dd342b82cc%7C5d7e43661b9b45cf8e79b14b27df46e1%7C0%7C0%7C638724083682129542%7CUnknown%7CTWFpbGZsb3d8eyJFbXB0eU1hcGkiOnRydWUsIlYiOiIwLjAuMDAwMCIsIlAiOiJXaW4zMiIsIkFOIjoiTWFpbCIsIldUIjoyfQ%3D%3D%7C0%7C%7C%7C&sdata=%2FrmKNJ1hVwWdQ5U05CvNXX1Df3f4SR2HAxTyZA3PJKw%3D&reserved=0 <https://github.com/rook/rook/discussions/13126#discussioncomment-10043490
_______________________________________________ ceph-users mailing list -- ceph-users@ceph.io<mailto:ceph-users@ceph.io> To unsubscribe send an email to ceph-users-leave@ceph.io<mailto:ceph-users-leave@ceph.io>
_______________________________________________ ceph-users mailing list -- ceph-users@ceph.io To unsubscribe send an email to ceph-users-leave@ceph.io
_______________________________________________ ceph-users mailing list -- ceph-users@ceph.io To unsubscribe send an email to ceph-users-leave@ceph.io
_______________________________________________ ceph-users mailing list -- ceph-users@ceph.io To unsubscribe send an email to ceph-users-leave@ceph.io
_______________________________________________ ceph-users mailing list -- ceph-users@ceph.io To unsubscribe send an email to ceph-users-leave@ceph.io
Thanks for the pointer. I’ve been reading about this every now and then but haven’t really tried anything yet wrt templates. I’m gonna play around with this. Zitat von Redouane Kachach <rkachach@redhat.com>:
Just FYI: cephadm does support providing/using a custom template (see the docs on [1]). For example using the following cmd you can override the prometheus template:
ceph config-key set mgr/cephadm/services/prometheus/prometheus.yml <value>
After changing the template you have to reconfigure the service in order to redeploy the daemons with your new config by:
ceph orch reconfig prometheus
Then you can go to the corresponding directory on /var/lib/ceph/<your-fsid>/<your-daemon>/... to see if the container has got the new config.
*Note:* In general most of the templates have some variables and they are used to dynamically generate the configuration files. So be careful when changing the template. I'd recommend using the current one as base (you can see where to find them in the docs) and then modify it to add your custom config but without altering the dynamic parts of the template.
[1] https://docs.ceph.com/en/reef/cephadm/services/monitoring/#option-names
Best, Redo.
On Tue, Jan 14, 2025 at 8:45 AM Eugen Block <eblock@nde.ag> wrote:
Ah, I checked on a newer test cluster (Squid) and now I see what you mean. The alert is shown per OSD in the dashboard, if you open the dropdown you see which daemons are affected. I think it works a bit different in Pacific (that's what the customer is still running) when I last had to modify this. How many OSDs do you have? I noticed that it takes a few seconds for prometheus to clear the warning with only 3 OSDs in my lab cluster. Maybe you could share a screenshot (with redacted sensitive data) showing the alerts? And the status of the affected OSDs as well.
Zitat von "Devin A. Bougie" <devin.bougie@cornell.edu>:
Hi Eugen,
No, as far as I can tell I only have one prometheus service running.
———
[root@cephman2 ~]# ceph orch ls prometheus --export
service_type: prometheus
service_name: prometheus
placement:
count: 1
label: _admin
[root@cephman2 ~]# ceph orch ps --daemon-type prometheus
NAME HOST PORTS STATUS REFRESHED AGE MEM USE MEM LIM VERSION IMAGE ID CONTAINER ID
prometheus.cephman2 cephman2.classe.cornell.edu *:9095 running (12h) 4m ago 3w 350M - 2.43.0 a07b618ecd1d 5a8d88682c28
———
Anything else I can check or do?
Thanks, Devin
On Jan 13, 2025, at 6:39 PM, Eugen Block <eblock@nde.ag> wrote:
Do you have two Prometheus instances? Maybe you could share ceph orch ls prometheus --export
Or alternatively: ceph orch ps --daemon-type prometheus
You can use two instances for HA, but then you need to change the threshold for both, of course.
Zitat von "Devin A. Bougie" <devin.bougie@cornell.edu<mailto:devin.bougie@cornell.edu>>:
Thanks, Eugen! Just incase you have any more suggestions, this still isn’t quite working for us.
Perhaps one clue is that in the Alerts view of the cephadm dashboard, every alert is listed twice. We see two CephPGImbalance alerts, both set to 30% after redeploying the service. If I then follow your procedure, one of the alerts updates to 50% as configured, but the other stays at 30. Is it normal to see each alert listed twice, or did I somehow make a mess of things when trying to change the default alerts?
No problem if it’s not an obvious answer, we can live with and ignore the spurious CephPGImbalance alerts.
Thanks again, Devin
On Jan 7, 2025, at 2:14 AM, Eugen Block <eblock@nde.ag> wrote:
Hi,
sure thing, here's the diff how I changed it to 50% deviation instead of 30%:
---snip--- diff -u
/var/lib/ceph/{FSID}/prometheus.host1/etc/prometheus/alerting/ceph_alerts.yml
/var/lib/ceph/{FSID}/prometheus.host1/etc/prometheus/alerting/ceph_alerts.yml.dist
---
/var/lib/ceph/{FSID}/prometheus.host1/etc/prometheus/alerting/ceph_alerts.yml 2024-12-17 10:03:23.540179209
+0100 +++
/var/lib/ceph/{FSID}/prometheus.host1/etc/prometheus/alerting/ceph_alerts.yml.dist 2024-12-17 10:03:00.380883413
+0100 @@ -237,13 +237,13 @@ type: "ceph_default" - alert: "CephPGImbalance" annotations: - description: "OSD {{ $labels.ceph_daemon }} on {{ $labels.hostname }} deviates by more than 50% from average PG count." + description: "OSD {{ $labels.ceph_daemon }} on {{ $labels.hostname }} deviates by more than 30% from average PG count." summary: "PGs are not balanced across OSDs" expr: | abs( ((ceph_osd_numpg > 0) - on (job) group_left avg(ceph_osd_numpg > 0) by (job)) / on (job) group_left avg(ceph_osd_numpg > 0) by (job) - ) * on (ceph_daemon) group_left(hostname) ceph_osd_metadata > 0.50 + ) * on (ceph_daemon) group_left(hostname) ceph_osd_metadata > 0.30 ---snip---
Then you restart prometheus ('ceph orch ps --daemon-type prometheus' shows you the exact daemon name):
ceph orch daemon restart prometheus.host1
This will only work until you upgrade prometheus, of course.
Regards, Eugen
Zitat von "Devin A. Bougie" <devin.bougie@cornell.edu>:
Thanks, Eugen. I’m afraid I haven’t yet found a way to either disable the CephPGImbalance alert or change it to handle different OSD sizes. Changing /var/lib/ceph/<cluster_id>/home/ceph_default_alerts.yml doesn’t seem to have any effect, and I haven’t even managed to change the behavior from within the running prometheus container.
If you have a functioning workaround, can you give a little more detail on exactly what yaml file you’re changing and where?
Thanks again, Devin
On Dec 30, 2024, at 12:39 PM, Eugen Block <eblock@nde.ag> wrote:
Funny, I wanted to take a look next week how to deal with different OSD sizes or if somebody already has a fix for that. My workaround is changing the yaml file for Prometheus as well.
Zitat von "Devin A. Bougie" <devin.bougie@cornell.edu>:
Hi, All. We are using cephadm to manage a 19.2.0 cluster on fully-updated AlmaLinux 9 hosts, and would greatly appreciate help modifying or overriding the alert rules in ceph_default_alerts.yml. Is the best option to simply update the /var/lib/ceph/<cluster_id>/home/ceph_default_alerts.yml file?
In particular, we’d like to either disable the CephPGImbalance alert or change it to calculate averages per-pool or per-crush_rule instead of globally as in [1].
We currently have PG autoscaling enabled, and have two separate crush_rules (one with large spinning disks, one with much smaller nvme drives). Although I don’t believe it causes any technical issues with our configuration, our dashboard is full of CephPGImbalance alerts that would be nice to clean up without having to create periodic silences.
Any help or suggestions would be greatly appreciated.
Many thanks, Devin
[1]
https://nam12.safelinks.protection.outlook.com/?url=https%3A%2F%2Fgithub.com%2Frook%2Frook%2Fdiscussions%2F13126%23discussioncomment-10043490&data=05%7C02%7Cdevin.bougie%40cornell.edu%7C27dddfa00b2e4475b30e08dd342b82cc%7C5d7e43661b9b45cf8e79b14b27df46e1%7C0%7C0%7C638724083682129542%7CUnknown%7CTWFpbGZsb3d8eyJFbXB0eU1hcGkiOnRydWUsIlYiOiIwLjAuMDAwMCIsIlAiOiJXaW4zMiIsIkFOIjoiTWFpbCIsIldUIjoyfQ%3D%3D%7C0%7C%7C%7C&sdata=%2FrmKNJ1hVwWdQ5U05CvNXX1Df3f4SR2HAxTyZA3PJKw%3D&reserved=0 <https://github.com/rook/rook/discussions/13126#discussioncomment-10043490
_______________________________________________ ceph-users mailing list -- ceph-users@ceph.io<mailto:ceph-users@ceph.io> To unsubscribe send an email to ceph-users-leave@ceph.io<mailto:ceph-users-leave@ceph.io>
_______________________________________________ ceph-users mailing list -- ceph-users@ceph.io To unsubscribe send an email to ceph-users-leave@ceph.io
_______________________________________________ ceph-users mailing list -- ceph-users@ceph.io To unsubscribe send an email to ceph-users-leave@ceph.io
_______________________________________________ ceph-users mailing list -- ceph-users@ceph.io To unsubscribe send an email to ceph-users-leave@ceph.io
_______________________________________________ ceph-users mailing list -- ceph-users@ceph.io To unsubscribe send an email to ceph-users-leave@ceph.io
Hi Redo, I've been looking into the templates and have a question. Maybe you could help clarify. I understand that I can create custom alerts and inject them with: ceph config-key set mgr/cephadm/services/prometheus/alerting/custom_alerts.yml -i custom_alerts.yml It works when I want additional alerts, okay. But this way I can not override the original alert (let's stay at "CephPGImbalance" as an example. I can create my own alert as described above (I don't even have to rename it), let's say 3% deviation in a test cluster, but it would show up in *addition* to the original 30% deviation. And although this command works as well (trying to override the defaults): ceph config-key set mgr/cephadm/services/prometheus/alerting/ceph_alerts.yml -i ceph_alerts.yml The default 30% value is not overridden. So the question is, how to actually change the original alert other than the workaround we already discussed here? Or am I misunderstanding something here? Thanks! Eugen Zitat von Redouane Kachach <rkachach@redhat.com>:
Just FYI: cephadm does support providing/using a custom template (see the docs on [1]). For example using the following cmd you can override the prometheus template:
ceph config-key set mgr/cephadm/services/prometheus/prometheus.yml <value>
After changing the template you have to reconfigure the service in order to redeploy the daemons with your new config by:
ceph orch reconfig prometheus
Then you can go to the corresponding directory on /var/lib/ceph/<your-fsid>/<your-daemon>/... to see if the container has got the new config.
*Note:* In general most of the templates have some variables and they are used to dynamically generate the configuration files. So be careful when changing the template. I'd recommend using the current one as base (you can see where to find them in the docs) and then modify it to add your custom config but without altering the dynamic parts of the template.
[1] https://docs.ceph.com/en/reef/cephadm/services/monitoring/#option-names
Best, Redo.
On Tue, Jan 14, 2025 at 8:45 AM Eugen Block <eblock@nde.ag> wrote:
Ah, I checked on a newer test cluster (Squid) and now I see what you mean. The alert is shown per OSD in the dashboard, if you open the dropdown you see which daemons are affected. I think it works a bit different in Pacific (that's what the customer is still running) when I last had to modify this. How many OSDs do you have? I noticed that it takes a few seconds for prometheus to clear the warning with only 3 OSDs in my lab cluster. Maybe you could share a screenshot (with redacted sensitive data) showing the alerts? And the status of the affected OSDs as well.
Zitat von "Devin A. Bougie" <devin.bougie@cornell.edu>:
Hi Eugen,
No, as far as I can tell I only have one prometheus service running.
———
[root@cephman2 ~]# ceph orch ls prometheus --export
service_type: prometheus
service_name: prometheus
placement:
count: 1
label: _admin
[root@cephman2 ~]# ceph orch ps --daemon-type prometheus
NAME HOST PORTS STATUS REFRESHED AGE MEM USE MEM LIM VERSION IMAGE ID CONTAINER ID
prometheus.cephman2 cephman2.classe.cornell.edu *:9095 running (12h) 4m ago 3w 350M - 2.43.0 a07b618ecd1d 5a8d88682c28
———
Anything else I can check or do?
Thanks, Devin
On Jan 13, 2025, at 6:39 PM, Eugen Block <eblock@nde.ag> wrote:
Do you have two Prometheus instances? Maybe you could share ceph orch ls prometheus --export
Or alternatively: ceph orch ps --daemon-type prometheus
You can use two instances for HA, but then you need to change the threshold for both, of course.
Zitat von "Devin A. Bougie" <devin.bougie@cornell.edu<mailto:devin.bougie@cornell.edu>>:
Thanks, Eugen! Just incase you have any more suggestions, this still isn’t quite working for us.
Perhaps one clue is that in the Alerts view of the cephadm dashboard, every alert is listed twice. We see two CephPGImbalance alerts, both set to 30% after redeploying the service. If I then follow your procedure, one of the alerts updates to 50% as configured, but the other stays at 30. Is it normal to see each alert listed twice, or did I somehow make a mess of things when trying to change the default alerts?
No problem if it’s not an obvious answer, we can live with and ignore the spurious CephPGImbalance alerts.
Thanks again, Devin
On Jan 7, 2025, at 2:14 AM, Eugen Block <eblock@nde.ag> wrote:
Hi,
sure thing, here's the diff how I changed it to 50% deviation instead of 30%:
---snip--- diff -u
/var/lib/ceph/{FSID}/prometheus.host1/etc/prometheus/alerting/ceph_alerts.yml
/var/lib/ceph/{FSID}/prometheus.host1/etc/prometheus/alerting/ceph_alerts.yml.dist
---
/var/lib/ceph/{FSID}/prometheus.host1/etc/prometheus/alerting/ceph_alerts.yml 2024-12-17 10:03:23.540179209
+0100 +++
/var/lib/ceph/{FSID}/prometheus.host1/etc/prometheus/alerting/ceph_alerts.yml.dist 2024-12-17 10:03:00.380883413
+0100 @@ -237,13 +237,13 @@ type: "ceph_default" - alert: "CephPGImbalance" annotations: - description: "OSD {{ $labels.ceph_daemon }} on {{ $labels.hostname }} deviates by more than 50% from average PG count." + description: "OSD {{ $labels.ceph_daemon }} on {{ $labels.hostname }} deviates by more than 30% from average PG count." summary: "PGs are not balanced across OSDs" expr: | abs( ((ceph_osd_numpg > 0) - on (job) group_left avg(ceph_osd_numpg > 0) by (job)) / on (job) group_left avg(ceph_osd_numpg > 0) by (job) - ) * on (ceph_daemon) group_left(hostname) ceph_osd_metadata > 0.50 + ) * on (ceph_daemon) group_left(hostname) ceph_osd_metadata > 0.30 ---snip---
Then you restart prometheus ('ceph orch ps --daemon-type prometheus' shows you the exact daemon name):
ceph orch daemon restart prometheus.host1
This will only work until you upgrade prometheus, of course.
Regards, Eugen
Zitat von "Devin A. Bougie" <devin.bougie@cornell.edu>:
Thanks, Eugen. I’m afraid I haven’t yet found a way to either disable the CephPGImbalance alert or change it to handle different OSD sizes. Changing /var/lib/ceph/<cluster_id>/home/ceph_default_alerts.yml doesn’t seem to have any effect, and I haven’t even managed to change the behavior from within the running prometheus container.
If you have a functioning workaround, can you give a little more detail on exactly what yaml file you’re changing and where?
Thanks again, Devin
On Dec 30, 2024, at 12:39 PM, Eugen Block <eblock@nde.ag> wrote:
Funny, I wanted to take a look next week how to deal with different OSD sizes or if somebody already has a fix for that. My workaround is changing the yaml file for Prometheus as well.
Zitat von "Devin A. Bougie" <devin.bougie@cornell.edu>:
Hi, All. We are using cephadm to manage a 19.2.0 cluster on fully-updated AlmaLinux 9 hosts, and would greatly appreciate help modifying or overriding the alert rules in ceph_default_alerts.yml. Is the best option to simply update the /var/lib/ceph/<cluster_id>/home/ceph_default_alerts.yml file?
In particular, we’d like to either disable the CephPGImbalance alert or change it to calculate averages per-pool or per-crush_rule instead of globally as in [1].
We currently have PG autoscaling enabled, and have two separate crush_rules (one with large spinning disks, one with much smaller nvme drives). Although I don’t believe it causes any technical issues with our configuration, our dashboard is full of CephPGImbalance alerts that would be nice to clean up without having to create periodic silences.
Any help or suggestions would be greatly appreciated.
Many thanks, Devin
[1]
https://nam12.safelinks.protection.outlook.com/?url=https%3A%2F%2Fgithub.com%2Frook%2Frook%2Fdiscussions%2F13126%23discussioncomment-10043490&data=05%7C02%7Cdevin.bougie%40cornell.edu%7C27dddfa00b2e4475b30e08dd342b82cc%7C5d7e43661b9b45cf8e79b14b27df46e1%7C0%7C0%7C638724083682129542%7CUnknown%7CTWFpbGZsb3d8eyJFbXB0eU1hcGkiOnRydWUsIlYiOiIwLjAuMDAwMCIsIlAiOiJXaW4zMiIsIkFOIjoiTWFpbCIsIldUIjoyfQ%3D%3D%7C0%7C%7C%7C&sdata=%2FrmKNJ1hVwWdQ5U05CvNXX1Df3f4SR2HAxTyZA3PJKw%3D&reserved=0 <https://github.com/rook/rook/discussions/13126#discussioncomment-10043490
_______________________________________________ ceph-users mailing list -- ceph-users@ceph.io<mailto:ceph-users@ceph.io> To unsubscribe send an email to ceph-users-leave@ceph.io<mailto:ceph-users-leave@ceph.io>
_______________________________________________ ceph-users mailing list -- ceph-users@ceph.io To unsubscribe send an email to ceph-users-leave@ceph.io
_______________________________________________ ceph-users mailing list -- ceph-users@ceph.io To unsubscribe send an email to ceph-users-leave@ceph.io
_______________________________________________ ceph-users mailing list -- ceph-users@ceph.io To unsubscribe send an email to ceph-users-leave@ceph.io
_______________________________________________ ceph-users mailing list -- ceph-users@ceph.io To unsubscribe send an email to ceph-users-leave@ceph.io
Hi Eugen, Not sure if that will work or not (I didn't try it myself) but there's an option to configure the ceph alerts path in cephadm: Option( 'prometheus_alerts_path', type='str', *default='/etc/prometheus/ceph/ceph_default_alerts.yml'*, desc='location of alerts to include in prometheus deployments', ), The file */etc/prometheus/ceph/ceph_default_alerts.yml* comes with the ceph container but you can adjust the above path variable to have the container read other file of your choice (passing the corresponding mount) As I said I didn't test the above... but sounds like an option. Best, Redo. On Thu, Jan 16, 2025 at 3:26 PM Eugen Block <eblock@nde.ag> wrote:
Hi Redo,
I've been looking into the templates and have a question. Maybe you could help clarify. I understand that I can create custom alerts and inject them with:
ceph config-key set mgr/cephadm/services/prometheus/alerting/custom_alerts.yml -i custom_alerts.yml
It works when I want additional alerts, okay.
But this way I can not override the original alert (let's stay at "CephPGImbalance" as an example. I can create my own alert as described above (I don't even have to rename it), let's say 3% deviation in a test cluster, but it would show up in *addition* to the original 30% deviation. And although this command works as well (trying to override the defaults):
ceph config-key set mgr/cephadm/services/prometheus/alerting/ceph_alerts.yml -i ceph_alerts.yml
The default 30% value is not overridden. So the question is, how to actually change the original alert other than the workaround we already discussed here? Or am I misunderstanding something here?
Thanks! Eugen
Zitat von Redouane Kachach <rkachach@redhat.com>:
Just FYI: cephadm does support providing/using a custom template (see the docs on [1]). For example using the following cmd you can override the prometheus template:
ceph config-key set mgr/cephadm/services/prometheus/prometheus.yml <value>
After changing the template you have to reconfigure the service in order to redeploy the daemons with your new config by:
ceph orch reconfig prometheus
Then you can go to the corresponding directory on /var/lib/ceph/<your-fsid>/<your-daemon>/... to see if the container has got the new config.
*Note:* In general most of the templates have some variables and they are used to dynamically generate the configuration files. So be careful when changing the template. I'd recommend using the current one as base (you can see where to find them in the docs) and then modify it to add your custom config but without altering the dynamic parts of the template.
[1] https://docs.ceph.com/en/reef/cephadm/services/monitoring/#option-names
Best, Redo.
On Tue, Jan 14, 2025 at 8:45 AM Eugen Block <eblock@nde.ag> wrote:
Ah, I checked on a newer test cluster (Squid) and now I see what you mean. The alert is shown per OSD in the dashboard, if you open the dropdown you see which daemons are affected. I think it works a bit different in Pacific (that's what the customer is still running) when I last had to modify this. How many OSDs do you have? I noticed that it takes a few seconds for prometheus to clear the warning with only 3 OSDs in my lab cluster. Maybe you could share a screenshot (with redacted sensitive data) showing the alerts? And the status of the affected OSDs as well.
Zitat von "Devin A. Bougie" <devin.bougie@cornell.edu>:
Hi Eugen,
No, as far as I can tell I only have one prometheus service running.
———
[root@cephman2 ~]# ceph orch ls prometheus --export
service_type: prometheus
service_name: prometheus
placement:
count: 1
label: _admin
[root@cephman2 ~]# ceph orch ps --daemon-type prometheus
NAME HOST PORTS STATUS REFRESHED AGE MEM USE MEM LIM VERSION IMAGE ID CONTAINER ID
prometheus.cephman2 cephman2.classe.cornell.edu *:9095 running (12h) 4m ago 3w 350M - 2.43.0 a07b618ecd1d 5a8d88682c28
———
Anything else I can check or do?
Thanks, Devin
On Jan 13, 2025, at 6:39 PM, Eugen Block <eblock@nde.ag> wrote:
Do you have two Prometheus instances? Maybe you could share ceph orch ls prometheus --export
Or alternatively: ceph orch ps --daemon-type prometheus
You can use two instances for HA, but then you need to change the threshold for both, of course.
Zitat von "Devin A. Bougie" <devin.bougie@cornell.edu<mailto:devin.bougie@cornell.edu>>:
Thanks, Eugen! Just incase you have any more suggestions, this still isn’t quite working for us.
Perhaps one clue is that in the Alerts view of the cephadm dashboard, every alert is listed twice. We see two CephPGImbalance alerts, both set to 30% after redeploying the service. If I then follow your procedure, one of the alerts updates to 50% as configured, but the other stays at 30. Is it normal to see each alert listed twice, or did I somehow make a mess of things when trying to change the default alerts?
No problem if it’s not an obvious answer, we can live with and ignore the spurious CephPGImbalance alerts.
Thanks again, Devin
On Jan 7, 2025, at 2:14 AM, Eugen Block <eblock@nde.ag> wrote:
Hi,
sure thing, here's the diff how I changed it to 50% deviation instead of 30%:
---snip--- diff -u
/var/lib/ceph/{FSID}/prometheus.host1/etc/prometheus/alerting/ceph_alerts.yml
/var/lib/ceph/{FSID}/prometheus.host1/etc/prometheus/alerting/ceph_alerts.yml.dist
---
/var/lib/ceph/{FSID}/prometheus.host1/etc/prometheus/alerting/ceph_alerts.yml
2024-12-17 10:03:23.540179209
+0100 +++
/var/lib/ceph/{FSID}/prometheus.host1/etc/prometheus/alerting/ceph_alerts.yml.dist
2024-12-17 10:03:00.380883413
+0100 @@ -237,13 +237,13 @@ type: "ceph_default" - alert: "CephPGImbalance" annotations: - description: "OSD {{ $labels.ceph_daemon }} on {{ $labels.hostname }} deviates by more than 50% from average PG count." + description: "OSD {{ $labels.ceph_daemon }} on {{ $labels.hostname }} deviates by more than 30% from average PG count." summary: "PGs are not balanced across OSDs" expr: | abs( ((ceph_osd_numpg > 0) - on (job) group_left avg(ceph_osd_numpg > 0) by (job)) / on (job) group_left avg(ceph_osd_numpg > 0) by (job) - ) * on (ceph_daemon) group_left(hostname)
ceph_osd_metadata >
0.50
+ ) * on (ceph_daemon) group_left(hostname) ceph_osd_metadata > 0.30 ---snip---
Then you restart prometheus ('ceph orch ps --daemon-type prometheus' shows you the exact daemon name):
ceph orch daemon restart prometheus.host1
This will only work until you upgrade prometheus, of course.
Regards, Eugen
Zitat von "Devin A. Bougie" <devin.bougie@cornell.edu>:
Thanks, Eugen. I’m afraid I haven’t yet found a way to either disable the CephPGImbalance alert or change it to handle different OSD sizes. Changing /var/lib/ceph/<cluster_id>/home/ceph_default_alerts.yml doesn’t seem to have any effect, and I haven’t even managed to change the behavior from within the running prometheus container.
If you have a functioning workaround, can you give a little more detail on exactly what yaml file you’re changing and where?
Thanks again, Devin
On Dec 30, 2024, at 12:39 PM, Eugen Block <eblock@nde.ag> wrote:
Funny, I wanted to take a look next week how to deal with different OSD sizes or if somebody already has a fix for that. My workaround is changing the yaml file for Prometheus as well.
Zitat von "Devin A. Bougie" <devin.bougie@cornell.edu>:
Hi, All. We are using cephadm to manage a 19.2.0 cluster on fully-updated AlmaLinux 9 hosts, and would greatly appreciate help modifying or overriding the alert rules in ceph_default_alerts.yml. Is the best option to simply update the /var/lib/ceph/<cluster_id>/home/ceph_default_alerts.yml file?
In particular, we’d like to either disable the CephPGImbalance alert or change it to calculate averages per-pool or per-crush_rule instead of globally as in [1].
We currently have PG autoscaling enabled, and have two separate crush_rules (one with large spinning disks, one with much smaller nvme drives). Although I don’t believe it causes any technical issues with our configuration, our dashboard is full of CephPGImbalance alerts that would be nice to clean up without having to create periodic silences.
Any help or suggestions would be greatly appreciated.
Many thanks, Devin
[1]
< https://github.com/rook/rook/discussions/13126#discussioncomment-10043490
_______________________________________________ ceph-users mailing list -- ceph-users@ceph.io<mailto:
ceph-users@ceph.io>
To unsubscribe send an email to ceph-users-leave@ceph.io<mailto:ceph-users-leave@ceph.io>
_______________________________________________ ceph-users mailing list -- ceph-users@ceph.io To unsubscribe send an email to ceph-users-leave@ceph.io
_______________________________________________ ceph-users mailing list -- ceph-users@ceph.io To unsubscribe send an email to ceph-users-leave@ceph.io
_______________________________________________ ceph-users mailing list -- ceph-users@ceph.io To unsubscribe send an email to ceph-users-leave@ceph.io
_______________________________________________ ceph-users mailing list -- ceph-users@ceph.io To unsubscribe send an email to ceph-users-leave@ceph.io
Hi Redo, thanks for the suggestion. I haven't tried it either yet, but I think the easier option would be to simply keep a custom file on the prometheus host and map it into the container with extra_container_args. It's similar to your approach, I guess, but I wouldn't want to modify too much of the containers. I'll see what makes the most sense to us. Right now I'm testing our changes to consider OSD sizes for the PGImbalance alert. It's quite promising, I'll probably create a tracker once I have the customer's confirmation that it works for them as expected. Thanks! Eugen Zitat von Redouane Kachach <rkachach@redhat.com>:
Hi Eugen,
Not sure if that will work or not (I didn't try it myself) but there's an option to configure the ceph alerts path in cephadm:
Option( 'prometheus_alerts_path', type='str', *default='/etc/prometheus/ceph/ceph_default_alerts.yml'*, desc='location of alerts to include in prometheus deployments', ),
The file */etc/prometheus/ceph/ceph_default_alerts.yml* comes with the ceph container but you can adjust the above path variable to have the container read other file of your choice (passing the corresponding mount)
As I said I didn't test the above... but sounds like an option.
Best, Redo.
On Thu, Jan 16, 2025 at 3:26 PM Eugen Block <eblock@nde.ag> wrote:
Hi Redo,
I've been looking into the templates and have a question. Maybe you could help clarify. I understand that I can create custom alerts and inject them with:
ceph config-key set mgr/cephadm/services/prometheus/alerting/custom_alerts.yml -i custom_alerts.yml
It works when I want additional alerts, okay.
But this way I can not override the original alert (let's stay at "CephPGImbalance" as an example. I can create my own alert as described above (I don't even have to rename it), let's say 3% deviation in a test cluster, but it would show up in *addition* to the original 30% deviation. And although this command works as well (trying to override the defaults):
ceph config-key set mgr/cephadm/services/prometheus/alerting/ceph_alerts.yml -i ceph_alerts.yml
The default 30% value is not overridden. So the question is, how to actually change the original alert other than the workaround we already discussed here? Or am I misunderstanding something here?
Thanks! Eugen
Zitat von Redouane Kachach <rkachach@redhat.com>:
Just FYI: cephadm does support providing/using a custom template (see the docs on [1]). For example using the following cmd you can override the prometheus template:
ceph config-key set mgr/cephadm/services/prometheus/prometheus.yml <value>
After changing the template you have to reconfigure the service in order to redeploy the daemons with your new config by:
ceph orch reconfig prometheus
Then you can go to the corresponding directory on /var/lib/ceph/<your-fsid>/<your-daemon>/... to see if the container has got the new config.
*Note:* In general most of the templates have some variables and they are used to dynamically generate the configuration files. So be careful when changing the template. I'd recommend using the current one as base (you can see where to find them in the docs) and then modify it to add your custom config but without altering the dynamic parts of the template.
[1] https://docs.ceph.com/en/reef/cephadm/services/monitoring/#option-names
Best, Redo.
On Tue, Jan 14, 2025 at 8:45 AM Eugen Block <eblock@nde.ag> wrote:
Ah, I checked on a newer test cluster (Squid) and now I see what you mean. The alert is shown per OSD in the dashboard, if you open the dropdown you see which daemons are affected. I think it works a bit different in Pacific (that's what the customer is still running) when I last had to modify this. How many OSDs do you have? I noticed that it takes a few seconds for prometheus to clear the warning with only 3 OSDs in my lab cluster. Maybe you could share a screenshot (with redacted sensitive data) showing the alerts? And the status of the affected OSDs as well.
Zitat von "Devin A. Bougie" <devin.bougie@cornell.edu>:
Hi Eugen,
No, as far as I can tell I only have one prometheus service running.
———
[root@cephman2 ~]# ceph orch ls prometheus --export
service_type: prometheus
service_name: prometheus
placement:
count: 1
label: _admin
[root@cephman2 ~]# ceph orch ps --daemon-type prometheus
NAME HOST PORTS STATUS REFRESHED AGE MEM USE MEM LIM VERSION IMAGE ID CONTAINER ID
prometheus.cephman2 cephman2.classe.cornell.edu *:9095 running (12h) 4m ago 3w 350M - 2.43.0 a07b618ecd1d 5a8d88682c28
———
Anything else I can check or do?
Thanks, Devin
On Jan 13, 2025, at 6:39 PM, Eugen Block <eblock@nde.ag> wrote:
Do you have two Prometheus instances? Maybe you could share ceph orch ls prometheus --export
Or alternatively: ceph orch ps --daemon-type prometheus
You can use two instances for HA, but then you need to change the threshold for both, of course.
Zitat von "Devin A. Bougie" <devin.bougie@cornell.edu<mailto:devin.bougie@cornell.edu>>:
Thanks, Eugen! Just incase you have any more suggestions, this still isn’t quite working for us.
Perhaps one clue is that in the Alerts view of the cephadm dashboard, every alert is listed twice. We see two CephPGImbalance alerts, both set to 30% after redeploying the service. If I then follow your procedure, one of the alerts updates to 50% as configured, but the other stays at 30. Is it normal to see each alert listed twice, or did I somehow make a mess of things when trying to change the default alerts?
No problem if it’s not an obvious answer, we can live with and ignore the spurious CephPGImbalance alerts.
Thanks again, Devin
On Jan 7, 2025, at 2:14 AM, Eugen Block <eblock@nde.ag> wrote:
Hi,
sure thing, here's the diff how I changed it to 50% deviation instead of 30%:
---snip--- diff -u
/var/lib/ceph/{FSID}/prometheus.host1/etc/prometheus/alerting/ceph_alerts.yml
/var/lib/ceph/{FSID}/prometheus.host1/etc/prometheus/alerting/ceph_alerts.yml.dist
---
/var/lib/ceph/{FSID}/prometheus.host1/etc/prometheus/alerting/ceph_alerts.yml
2024-12-17 10:03:23.540179209
+0100 +++
/var/lib/ceph/{FSID}/prometheus.host1/etc/prometheus/alerting/ceph_alerts.yml.dist
2024-12-17 10:03:00.380883413
+0100 @@ -237,13 +237,13 @@ type: "ceph_default" - alert: "CephPGImbalance" annotations: - description: "OSD {{ $labels.ceph_daemon }} on {{ $labels.hostname }} deviates by more than 50% from average PG count." + description: "OSD {{ $labels.ceph_daemon }} on {{ $labels.hostname }} deviates by more than 30% from average PG count." summary: "PGs are not balanced across OSDs" expr: | abs( ((ceph_osd_numpg > 0) - on (job) group_left avg(ceph_osd_numpg > 0) by (job)) / on (job) group_left avg(ceph_osd_numpg > 0) by (job) - ) * on (ceph_daemon) group_left(hostname)
ceph_osd_metadata >
0.50
+ ) * on (ceph_daemon) group_left(hostname) ceph_osd_metadata > 0.30 ---snip---
Then you restart prometheus ('ceph orch ps --daemon-type prometheus' shows you the exact daemon name):
ceph orch daemon restart prometheus.host1
This will only work until you upgrade prometheus, of course.
Regards, Eugen
Zitat von "Devin A. Bougie" <devin.bougie@cornell.edu>:
Thanks, Eugen. I’m afraid I haven’t yet found a way to either disable the CephPGImbalance alert or change it to handle different OSD sizes. Changing /var/lib/ceph/<cluster_id>/home/ceph_default_alerts.yml doesn’t seem to have any effect, and I haven’t even managed to change the behavior from within the running prometheus container.
If you have a functioning workaround, can you give a little more detail on exactly what yaml file you’re changing and where?
Thanks again, Devin
On Dec 30, 2024, at 12:39 PM, Eugen Block <eblock@nde.ag> wrote:
Funny, I wanted to take a look next week how to deal with different OSD sizes or if somebody already has a fix for that. My workaround is changing the yaml file for Prometheus as well.
Zitat von "Devin A. Bougie" <devin.bougie@cornell.edu>:
Hi, All. We are using cephadm to manage a 19.2.0 cluster on fully-updated AlmaLinux 9 hosts, and would greatly appreciate help modifying or overriding the alert rules in ceph_default_alerts.yml. Is the best option to simply update the /var/lib/ceph/<cluster_id>/home/ceph_default_alerts.yml file?
In particular, we’d like to either disable the CephPGImbalance alert or change it to calculate averages per-pool or per-crush_rule instead of globally as in [1].
We currently have PG autoscaling enabled, and have two separate crush_rules (one with large spinning disks, one with much smaller nvme drives). Although I don’t believe it causes any technical issues with our configuration, our dashboard is full of CephPGImbalance alerts that would be nice to clean up without having to create periodic silences.
Any help or suggestions would be greatly appreciated.
Many thanks, Devin
[1]
< https://github.com/rook/rook/discussions/13126#discussioncomment-10043490
_______________________________________________ ceph-users mailing list -- ceph-users@ceph.io<mailto:
ceph-users@ceph.io>
To unsubscribe send an email to ceph-users-leave@ceph.io<mailto:ceph-users-leave@ceph.io>
_______________________________________________ ceph-users mailing list -- ceph-users@ceph.io To unsubscribe send an email to ceph-users-leave@ceph.io
_______________________________________________ ceph-users mailing list -- ceph-users@ceph.io To unsubscribe send an email to ceph-users-leave@ceph.io
_______________________________________________ ceph-users mailing list -- ceph-users@ceph.io To unsubscribe send an email to ceph-users-leave@ceph.io
_______________________________________________ ceph-users mailing list -- ceph-users@ceph.io To unsubscribe send an email to ceph-users-leave@ceph.io
Hi Eugen, I will take another look at the templating Redo mentioned, so feel free to ignore this for now. Since you asked, however, I wanted to answer your questions and send the requested screenshots. We have 70 OSDs, as in the first screenshot. 10 are 1TB NVMe’s in our five management nodes, and 60 are large 20TB SATA drives in our five osd nodes, as in the second screenshot. We have two crush_rules that are used to put our cephfs.data pool on the SATA drives, and the cephfs.meta, .mgr, and .nfs pools on the NVMe drives (screenshot 3). The fourth screenshot shows the alerts. If I click through them, the following OSDs are mentioned (a mix of NVMe’s and SATA): 64, 68, 62, 57, 67, 63, 6, 56, 28, 37, 20, 52, 11, 31, 35, 15, 1, 50, 66, 65, 40, 21, 60, 69, 61, 42 Lastly, the fifth and sixth screenshots shows the alert rules I see in the dashboard. Thanks again for your time and help. Sincerely, Devin [cid:d7a17b68-1b09-4736-a2f8-0f7a6adf1fb8@namprd04.prod.outlook.com] [cid:59ca66da-3f74-4d0b-b946-e3ce93e54b6f@namprd04.prod.outlook.com] [cid:33782c9d-bfa1-4d73-8162-dd1433b8e64d@namprd04.prod.outlook.com] [cid:0800b6d5-6efc-4425-918a-d0c4633b4575@namprd04.prod.outlook.com] [cid:21ded60a-e7fa-4edc-b5a1-b7aa0c7b8fec@namprd04.prod.outlook.com] [cid:5921b763-9a3f-421b-86b0-7a7d617718bb@namprd04.prod.outlook.com]
On Jan 14, 2025, at 2:44 AM, Eugen Block <eblock@nde.ag> wrote:
Ah, I checked on a newer test cluster (Squid) and now I see what you mean. The alert is shown per OSD in the dashboard, if you open the dropdown you see which daemons are affected. I think it works a bit different in Pacific (that's what the customer is still running) when I last had to modify this. How many OSDs do you have? I noticed that it takes a few seconds for prometheus to clear the warning with only 3 OSDs in my lab cluster. Maybe you could share a screenshot (with redacted sensitive data) showing the alerts? And the status of the affected OSDs as well.
Zitat von "Devin A. Bougie" <devin.bougie@cornell.edu>:
Hi Eugen,
No, as far as I can tell I only have one prometheus service running.
———
[root@cephman2 ~]# ceph orch ls prometheus --export
service_type: prometheus
service_name: prometheus
placement:
count: 1
label: _admin
[root@cephman2 ~]# ceph orch ps --daemon-type prometheus
NAME HOST PORTS STATUS REFRESHED AGE MEM USE MEM LIM VERSION IMAGE ID CONTAINER ID
prometheus.cephman2 cephman2.classe.cornell.edu *:9095 running (12h) 4m ago 3w 350M - 2.43.0 a07b618ecd1d 5a8d88682c28
———
Anything else I can check or do?
Thanks, Devin
On Jan 13, 2025, at 6:39 PM, Eugen Block <eblock@nde.ag> wrote:
Do you have two Prometheus instances? Maybe you could share ceph orch ls prometheus --export
Or alternatively: ceph orch ps --daemon-type prometheus
You can use two instances for HA, but then you need to change the threshold for both, of course.
Zitat von "Devin A. Bougie" <devin.bougie@cornell.edu<mailto:devin.bougie@cornell.edu>>:
Thanks, Eugen! Just incase you have any more suggestions, this still isn’t quite working for us.
Perhaps one clue is that in the Alerts view of the cephadm dashboard, every alert is listed twice. We see two CephPGImbalance alerts, both set to 30% after redeploying the service. If I then follow your procedure, one of the alerts updates to 50% as configured, but the other stays at 30. Is it normal to see each alert listed twice, or did I somehow make a mess of things when trying to change the default alerts?
No problem if it’s not an obvious answer, we can live with and ignore the spurious CephPGImbalance alerts.
Thanks again, Devin
On Jan 7, 2025, at 2:14 AM, Eugen Block <eblock@nde.ag> wrote:
Hi,
sure thing, here's the diff how I changed it to 50% deviation instead of 30%:
---snip--- diff -u /var/lib/ceph/{FSID}/prometheus.host1/etc/prometheus/alerting/ceph_alerts.yml /var/lib/ceph/{FSID}/prometheus.host1/etc/prometheus/alerting/ceph_alerts.yml.dist --- /var/lib/ceph/{FSID}/prometheus.host1/etc/prometheus/alerting/ceph_alerts.yml 2024-12-17 10:03:23.540179209 +0100 +++ /var/lib/ceph/{FSID}/prometheus.host1/etc/prometheus/alerting/ceph_alerts.yml.dist 2024-12-17 10:03:00.380883413 +0100 @@ -237,13 +237,13 @@ type: "ceph_default" - alert: "CephPGImbalance" annotations: - description: "OSD {{ $labels.ceph_daemon }} on {{ $labels.hostname }} deviates by more than 50% from average PG count." + description: "OSD {{ $labels.ceph_daemon }} on {{ $labels.hostname }} deviates by more than 30% from average PG count." summary: "PGs are not balanced across OSDs" expr: | abs( ((ceph_osd_numpg > 0) - on (job) group_left avg(ceph_osd_numpg > 0) by (job)) / on (job) group_left avg(ceph_osd_numpg > 0) by (job) - ) * on (ceph_daemon) group_left(hostname) ceph_osd_metadata > 0.50 + ) * on (ceph_daemon) group_left(hostname) ceph_osd_metadata > 0.30 ---snip---
Then you restart prometheus ('ceph orch ps --daemon-type prometheus' shows you the exact daemon name):
ceph orch daemon restart prometheus.host1
This will only work until you upgrade prometheus, of course.
Regards, Eugen
Zitat von "Devin A. Bougie" <devin.bougie@cornell.edu>:
Thanks, Eugen. I’m afraid I haven’t yet found a way to either disable the CephPGImbalance alert or change it to handle different OSD sizes. Changing /var/lib/ceph/<cluster_id>/home/ceph_default_alerts.yml doesn’t seem to have any effect, and I haven’t even managed to change the behavior from within the running prometheus container.
If you have a functioning workaround, can you give a little more detail on exactly what yaml file you’re changing and where?
Thanks again, Devin
On Dec 30, 2024, at 12:39 PM, Eugen Block <eblock@nde.ag> wrote:
Funny, I wanted to take a look next week how to deal with different OSD sizes or if somebody already has a fix for that. My workaround is changing the yaml file for Prometheus as well.
Zitat von "Devin A. Bougie" <devin.bougie@cornell.edu>:
Hi, All. We are using cephadm to manage a 19.2.0 cluster on fully-updated AlmaLinux 9 hosts, and would greatly appreciate help modifying or overriding the alert rules in ceph_default_alerts.yml. Is the best option to simply update the /var/lib/ceph/<cluster_id>/home/ceph_default_alerts.yml file?
In particular, we’d like to either disable the CephPGImbalance alert or change it to calculate averages per-pool or per-crush_rule instead of globally as in [1].
We currently have PG autoscaling enabled, and have two separate crush_rules (one with large spinning disks, one with much smaller nvme drives). Although I don’t believe it causes any technical issues with our configuration, our dashboard is full of CephPGImbalance alerts that would be nice to clean up without having to create periodic silences.
Any help or suggestions would be greatly appreciated.
Many thanks, Devin
[1] https://nam12.safelinks.protection.outlook.com/?url=https%3A%2F%2Fgithub.com%2Frook%2Frook%2Fdiscussions%2F13126%23discussioncomment-10043490&data=05%7C02%7Cdevin.bougie%40cornell.edu%7Ceeeadff3b0524bf5b83108dd346f5567%7C5d7e43661b9b45cf8e79b14b27df46e1%7C0%7C0%7C638724374974331608%7CUnknown%7CTWFpbGZsb3d8eyJFbXB0eU1hcGkiOnRydWUsIlYiOiIwLjAuMDAwMCIsIlAiOiJXaW4zMiIsIkFOIjoiTWFpbCIsIldUIjoyfQ%3D%3D%7C0%7C%7C%7C&sdata=PbWw2LCP4n9oRPis1IyHfCAGbJaVGzEqUbjMa8xe7oI%3D&reserved=0<https://nam12.safelinks.protection.outlook.com/?url=https%3A%2F%2Fgithub.com%2Frook%2Frook%2Fdiscussions%2F13126%23discussioncomment-10043490&data=05%7C02%7Cdevin.bougie%40cornell.edu%7Ceeeadff3b0524bf5b83108dd346f5567%7C5d7e43661b9b45cf8e79b14b27df46e1%7C0%7C0%7C638724374974350908%7CUnknown%7CTWFpbGZsb3d8eyJFbXB0eU1hcGkiOnRydWUsIlYiOiIwLjAuMDAwMCIsIlAiOiJXaW4zMiIsIkFOIjoiTWFpbCIsIldUIjoyfQ%3D%3D%7C0%7C%7C%7C&sdata=9Y%2BvPwsugkgLwvNJ%2Brz76%2FpM1K9wMzn2sY1bVDHWBh8%3D&reserved=0><https://github.com/rook/rook/discussions/13126#discussioncomment-10043490> _______________________________________________ ceph-users mailing list -- ceph-users@ceph.io<mailto:ceph-users@ceph.io> To unsubscribe send an email to ceph-users-leave@ceph.io<mailto:ceph-users-leave@ceph.io>
_______________________________________________ ceph-users mailing list -- ceph-users@ceph.io To unsubscribe send an email to ceph-users-leave@ceph.io
_______________________________________________ ceph-users mailing list -- ceph-users@ceph.io To unsubscribe send an email to ceph-users-leave@ceph.io
_______________________________________________ ceph-users mailing list -- ceph-users@ceph.io To unsubscribe send an email to ceph-users-leave@ceph.io
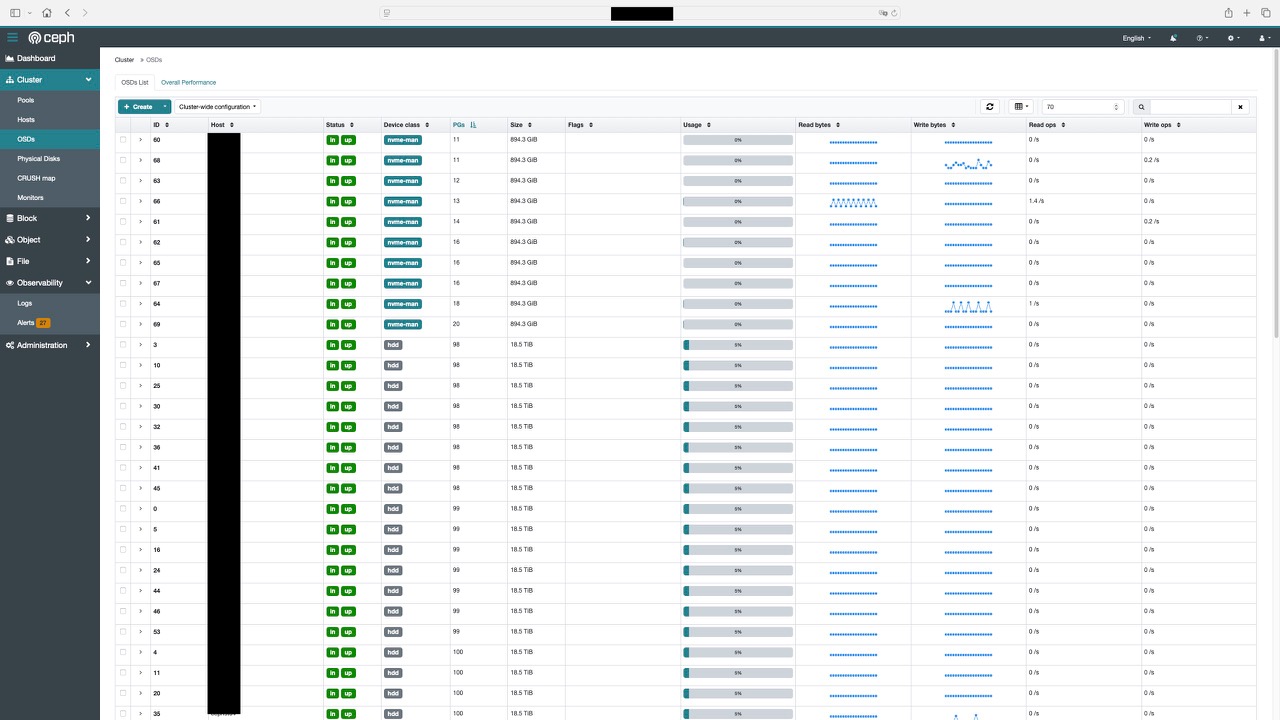
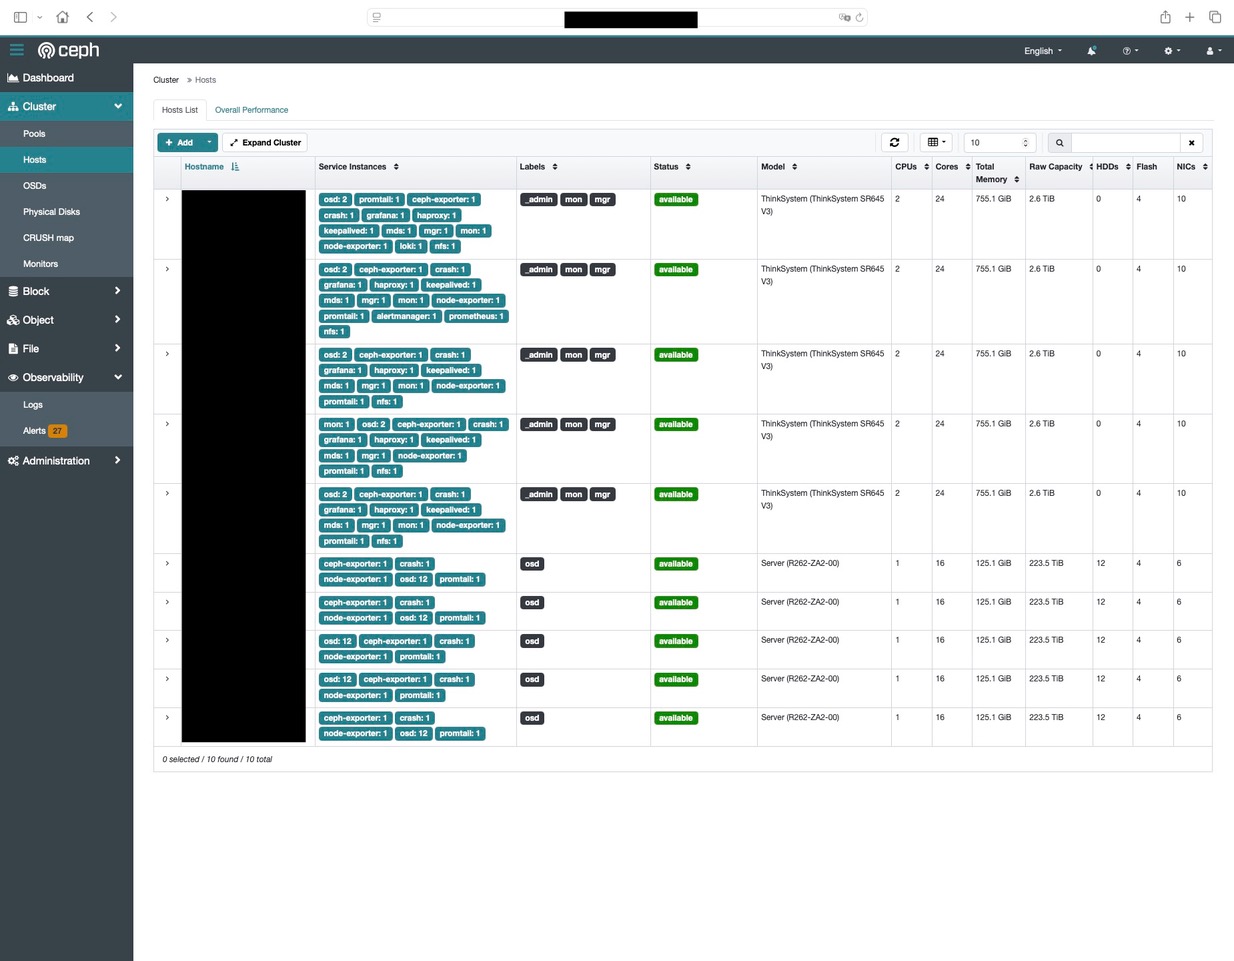
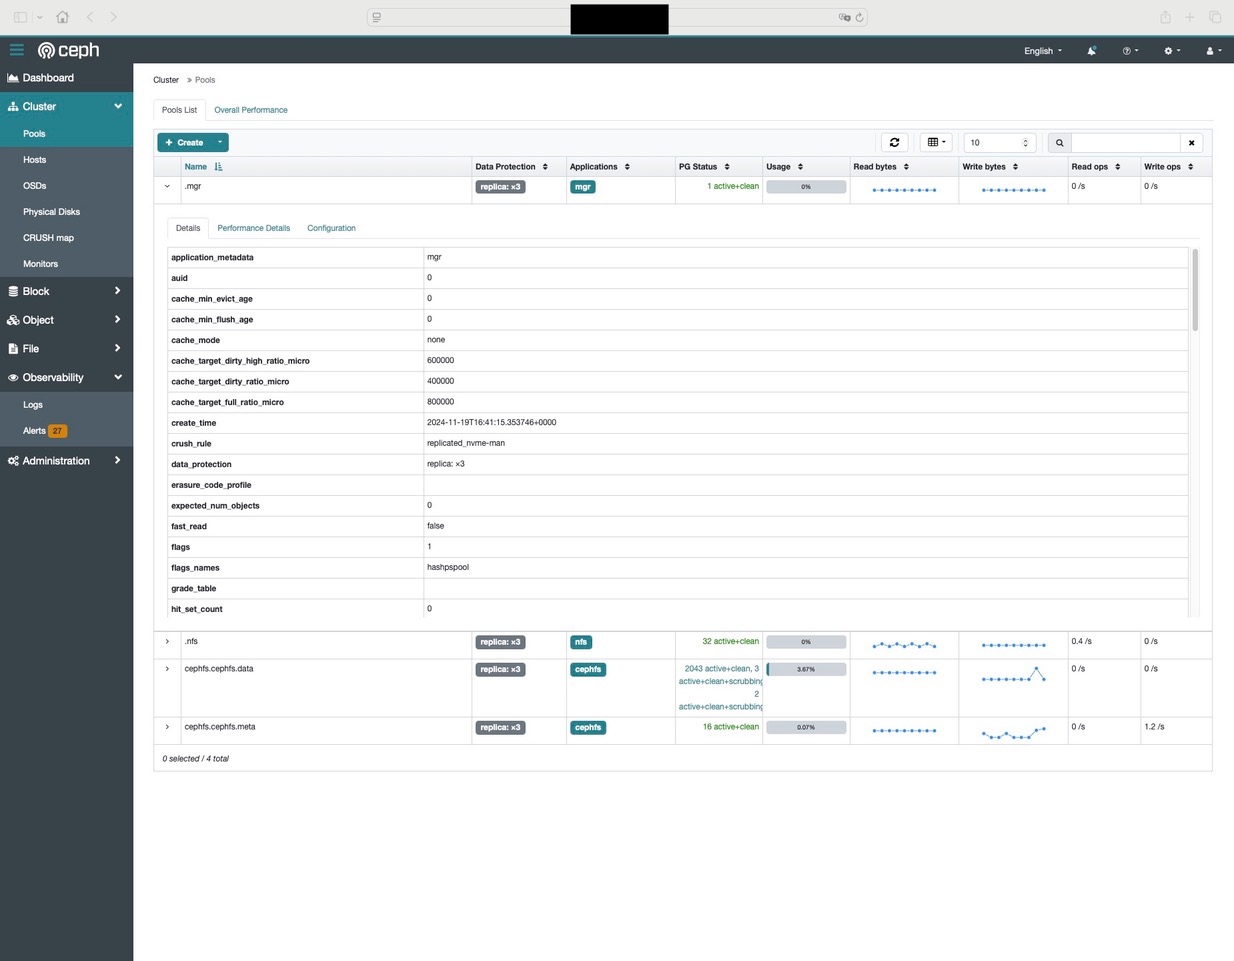
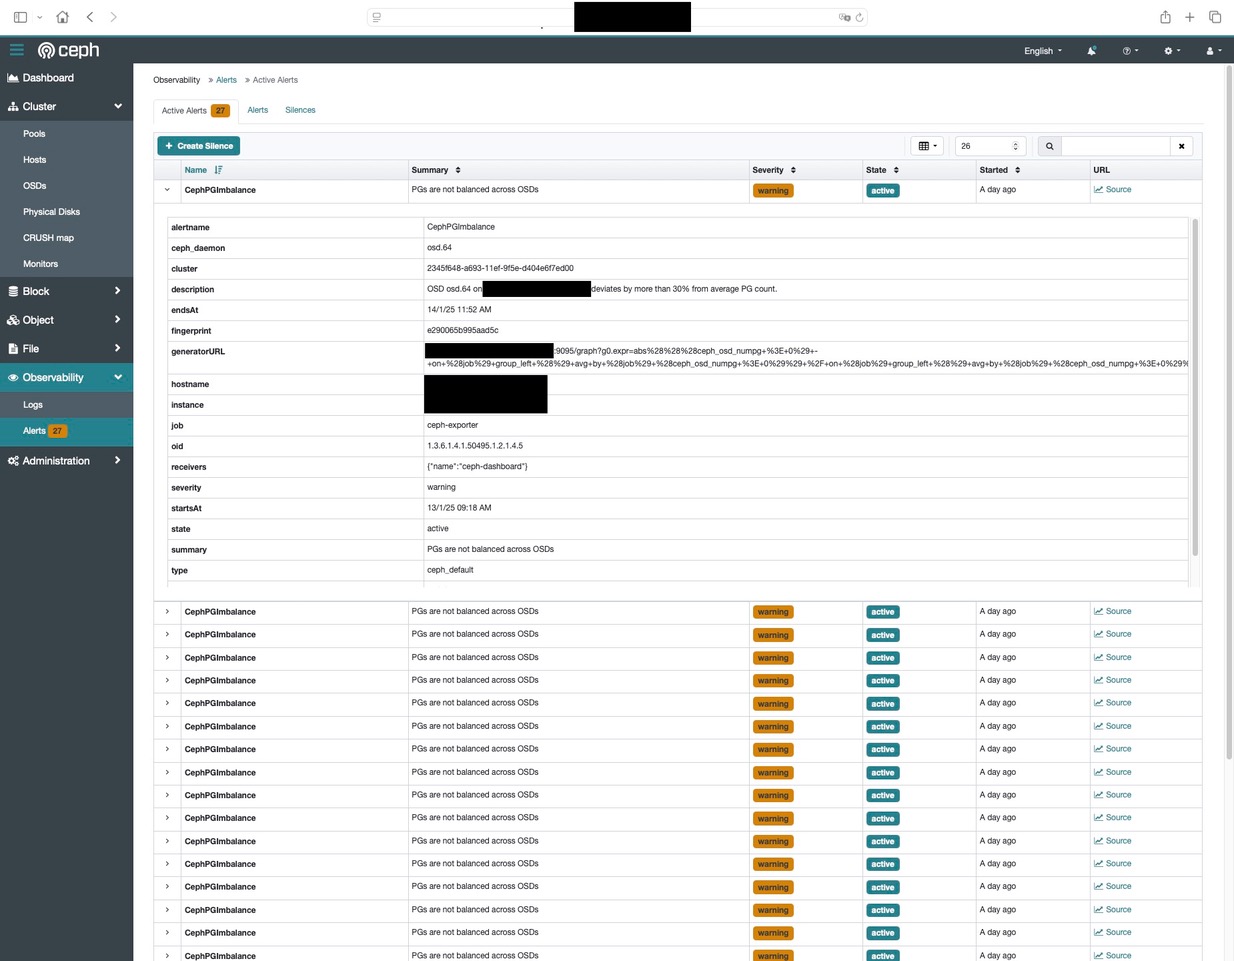
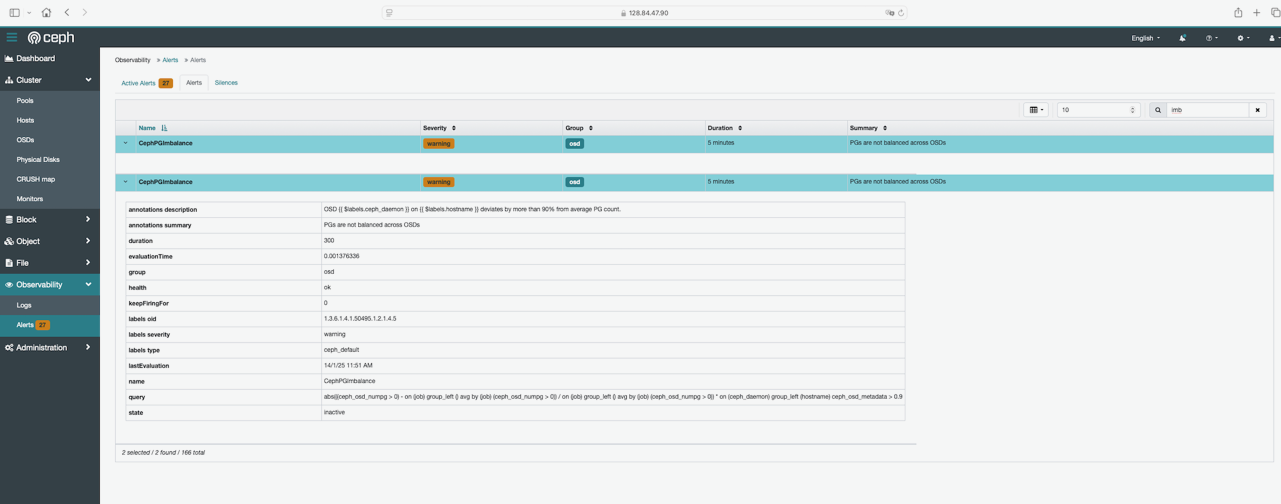
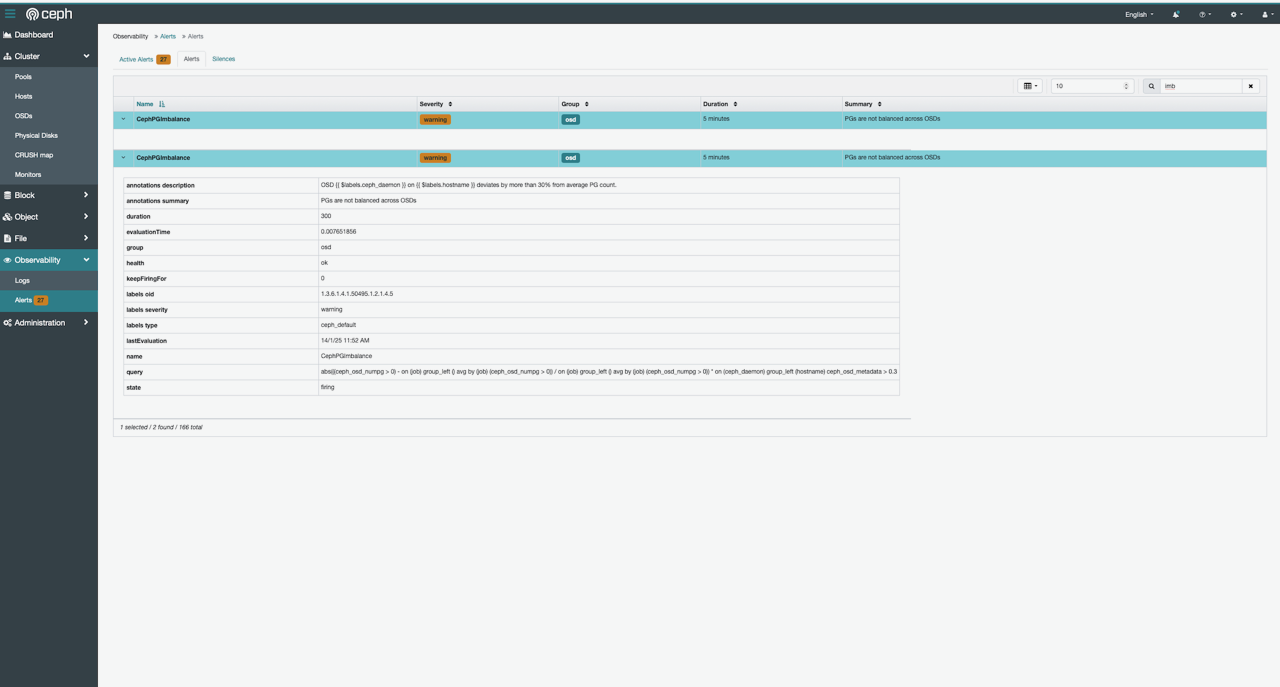
I just wanted to followup to explain how we ended up with each alert being listed twice, which also prevented our changes to ceph_alerts.yml from taking effect. We only had one prometheus service running, and only one PGImbalance rule in the /var/lib/ceph/{FSID}/prometheus.{host}/etc/prometheus/alerting/ceph_alerts.yml file. *However*, before modifying it I had first backed up the original file to /var/lib/ceph/{FSID}/prometheus.{host}/etc/prometheus/alerting/ceph_alerts.yml.bk Once I removed the ceph_alerts.yml.bk file, the dashboard only showed one alert rule as it should (modified for a deviation of 90%) and all of the “30%” active alerts cleared. So for now, at least until we figure out how to override a given alert using templates, Eugen’s procedure works fine. 1. Modify (but don’t backup or rename) /var/lib/ceph/{FSID}/prometheus.{host}/etc/prometheus/alerting/ceph_alerts.yml 2. Restart prometheus Many thanks to Eugen for their help tracking this down! Sincerely, Devin
On Jan 13, 2025, at 9:55 PM, Devin A. Bougie <devin.bougie@cornell.edu> wrote:
Hi Eugen,
No, as far as I can tell I only have one prometheus service running.
——— [root@cephman2 ~]# ceph orch ls prometheus --export service_type: prometheus service_name: prometheus placement: count: 1 label: _admin
[root@cephman2 ~]# ceph orch ps --daemon-type prometheus NAME HOST PORTS STATUS REFRESHED AGE MEM USE MEM LIM VERSION IMAGE ID CONTAINER ID prometheus.cephman2 cephman2.classe.cornell.edu *:9095 running (12h) 4m ago 3w 350M - 2.43.0 a07b618ecd1d 5a8d88682c28 ———
Anything else I can check or do?
Thanks, Devin
On Jan 13, 2025, at 6:39 PM, Eugen Block <eblock@nde.ag> wrote:
Do you have two Prometheus instances? Maybe you could share ceph orch ls prometheus --export
Or alternatively: ceph orch ps --daemon-type prometheus
You can use two instances for HA, but then you need to change the threshold for both, of course.
Zitat von "Devin A. Bougie" <devin.bougie@cornell.edu>:
Thanks, Eugen! Just incase you have any more suggestions, this still isn’t quite working for us.
Perhaps one clue is that in the Alerts view of the cephadm dashboard, every alert is listed twice. We see two CephPGImbalance alerts, both set to 30% after redeploying the service. If I then follow your procedure, one of the alerts updates to 50% as configured, but the other stays at 30. Is it normal to see each alert listed twice, or did I somehow make a mess of things when trying to change the default alerts?
No problem if it’s not an obvious answer, we can live with and ignore the spurious CephPGImbalance alerts.
Thanks again, Devin
On Jan 7, 2025, at 2:14 AM, Eugen Block <eblock@nde.ag> wrote:
Hi,
sure thing, here's the diff how I changed it to 50% deviation instead of 30%:
---snip--- diff -u /var/lib/ceph/{FSID}/prometheus.host1/etc/prometheus/alerting/ceph_alerts.yml /var/lib/ceph/{FSID}/prometheus.host1/etc/prometheus/alerting/ceph_alerts.yml.dist --- /var/lib/ceph/{FSID}/prometheus.host1/etc/prometheus/alerting/ceph_alerts.yml 2024-12-17 10:03:23.540179209 +0100 +++ /var/lib/ceph/{FSID}/prometheus.host1/etc/prometheus/alerting/ceph_alerts.yml.dist 2024-12-17 10:03:00.380883413 +0100 @@ -237,13 +237,13 @@ type: "ceph_default" - alert: "CephPGImbalance" annotations: - description: "OSD {{ $labels.ceph_daemon }} on {{ $labels.hostname }} deviates by more than 50% from average PG count." + description: "OSD {{ $labels.ceph_daemon }} on {{ $labels.hostname }} deviates by more than 30% from average PG count." summary: "PGs are not balanced across OSDs" expr: | abs( ((ceph_osd_numpg > 0) - on (job) group_left avg(ceph_osd_numpg > 0) by (job)) / on (job) group_left avg(ceph_osd_numpg > 0) by (job) - ) * on (ceph_daemon) group_left(hostname) ceph_osd_metadata > 0.50 + ) * on (ceph_daemon) group_left(hostname) ceph_osd_metadata > 0.30 ---snip---
Then you restart prometheus ('ceph orch ps --daemon-type prometheus' shows you the exact daemon name):
ceph orch daemon restart prometheus.host1
This will only work until you upgrade prometheus, of course.
Regards, Eugen
Zitat von "Devin A. Bougie" <devin.bougie@cornell.edu>:
Thanks, Eugen. I’m afraid I haven’t yet found a way to either disable the CephPGImbalance alert or change it to handle different OSD sizes. Changing /var/lib/ceph/<cluster_id>/home/ceph_default_alerts.yml doesn’t seem to have any effect, and I haven’t even managed to change the behavior from within the running prometheus container.
If you have a functioning workaround, can you give a little more detail on exactly what yaml file you’re changing and where?
Thanks again, Devin
On Dec 30, 2024, at 12:39 PM, Eugen Block <eblock@nde.ag> wrote:
Funny, I wanted to take a look next week how to deal with different OSD sizes or if somebody already has a fix for that. My workaround is changing the yaml file for Prometheus as well.
Zitat von "Devin A. Bougie" <devin.bougie@cornell.edu>:
> Hi, All. We are using cephadm to manage a 19.2.0 cluster on fully-updated AlmaLinux 9 hosts, and would greatly appreciate help modifying or overriding the alert rules in ceph_default_alerts.yml. Is the best option to simply update the /var/lib/ceph/<cluster_id>/home/ceph_default_alerts.yml file? > > In particular, we’d like to either disable the CephPGImbalance alert or change it to calculate averages per-pool or per-crush_rule instead of globally as in [1]. > > We currently have PG autoscaling enabled, and have two separate crush_rules (one with large spinning disks, one with much smaller nvme drives). Although I don’t believe it causes any technical issues with our configuration, our dashboard is full of CephPGImbalance alerts that would be nice to clean up without having to create periodic silences. > > Any help or suggestions would be greatly appreciated. > > Many thanks, > Devin > > [1] https://github.com/rook/rook/discussions/13126#discussioncomment-10043490 > _______________________________________________ > ceph-users mailing list -- ceph-users@ceph.io > To unsubscribe send an email to ceph-users-leave@ceph.io
_______________________________________________ ceph-users mailing list -- ceph-users@ceph.io To unsubscribe send an email to ceph-users-leave@ceph.io
_______________________________________________ ceph-users mailing list -- ceph-users@ceph.io To unsubscribe send an email to ceph-users-leave@ceph.io
_______________________________________________ ceph-users mailing list -- ceph-users@ceph.io To unsubscribe send an email to ceph-users-leave@ceph.io
participants (3)
-
Devin A. Bougie
-
Eugen Block
-
Redouane Kachach